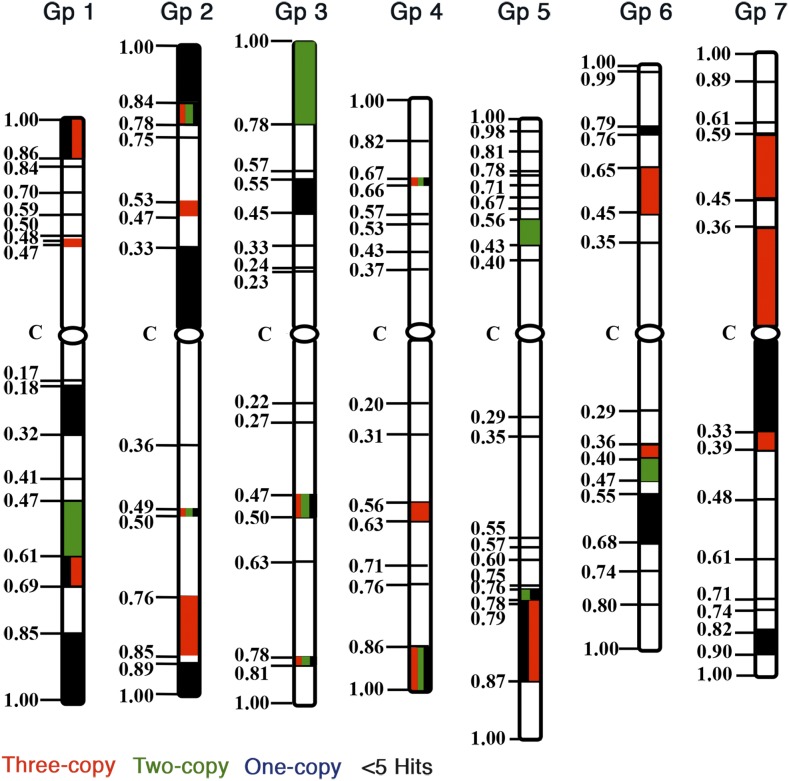
Figure 7.
A consensus expression map of 1030 ESTs (expressed sequence tags) with three structural copies physically localized to chromosome regions bracketed by wheat deletion breakpoints. The maps were drawn using the information from Qi et al. (2004). Fraction length for each chromosomal region is given on the left side of the chromosomes. Statistical significance was tested at P < 0.05. Red colored chromosomal regions show significantly higher proportions of gene expressing from all three homeologs, green marks regions with two of the three homeologs showing expression, and the regions mark in blue show significantly a higher proportion of genes expressing from only one of the three homeologs. Chromosome regions marketed with black show a significantly higher proportion of genes with < 5 ESTs.

