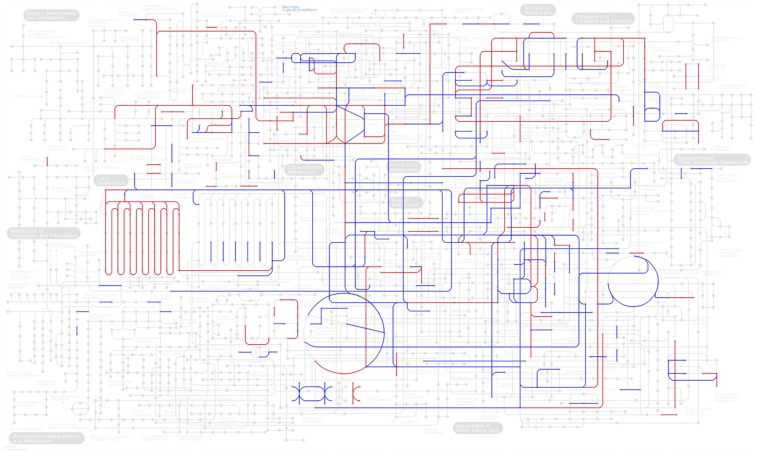
Figure 1.
Protein phosphorylation is likely to exert significant control over S. cerevisiae central metabolism. Nodes represent metabolites and lines represent reactions in the Kyoto Encyclopedia of Genes and Genomes (KEGG) metabolic map. Blue color is for reactions that are controlled by at least one enzyme that undergoes phosphorylation. Red color is for reactions that are controlled by at least one enzyme that contains High Confidence (HC) p-site/s. Mapping was performed with the KEGG mapper tool (Kanehisa et al. 2012), using the Uniprot identifiers of the yeast phosphorylated enzymes.

