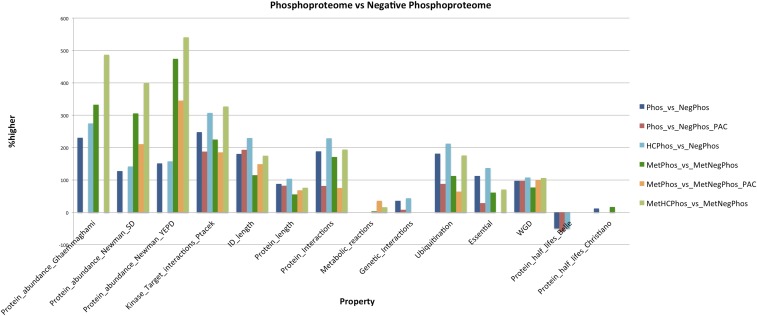
Figure 2.
The general properties of the phosphoproteome, compared to the negative phosphoproteome. The bars show which properties of the phosphoproteome are higher/lower (% difference), compared to the negative phosphoproteome. Only statistically significant differences are shown. This is estimated for various datasets. HC, High Confidence subset of the phosphoproteome; MetPhos_vs_MetNegPhos, metabolic proteins of the phosphoproteome vs. metabolic proteins of the negative phosphoproteome set. PAC, Protein Abundance Controlled dataset; Phos_vs_NegPhos: phosphoproteome vs. negative phosphoproteome.

