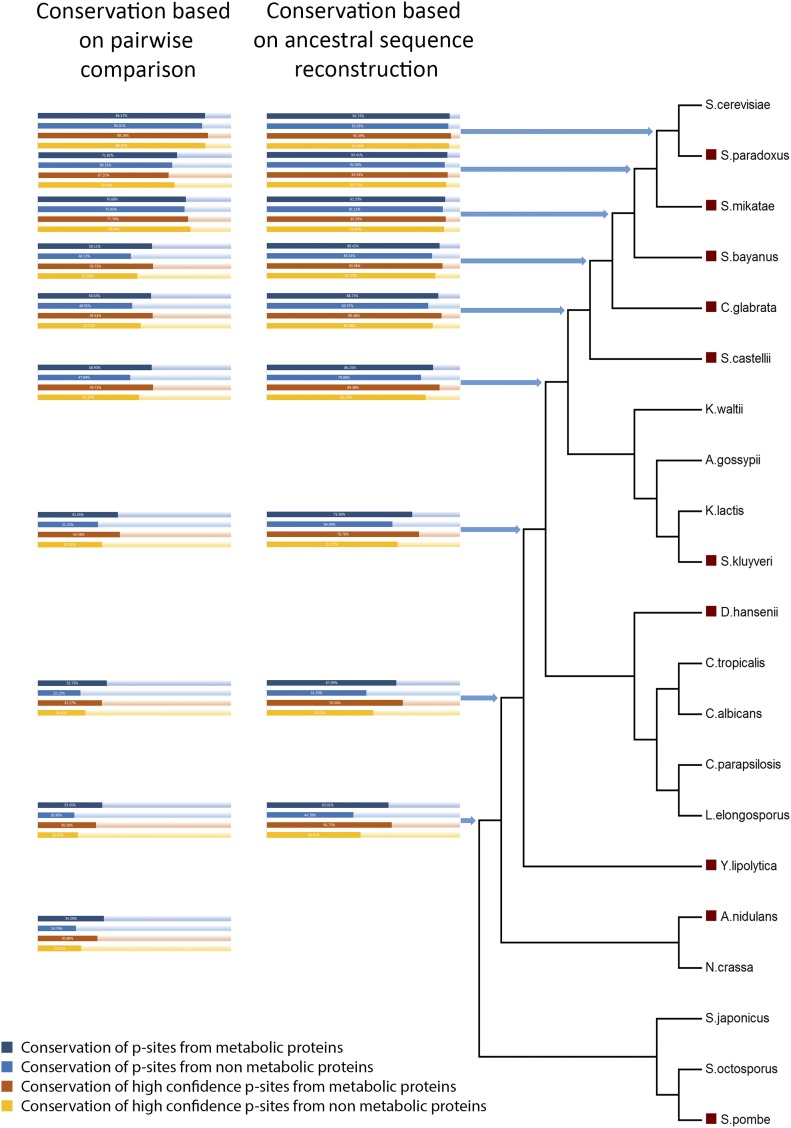
Figure 3.
Conservation of p-sites in various ascomycete ancestors. Conservation was inferred by two different methods: pairwise comparison of yeast with other extant species (red boxes in the phylogenetic tree) and ancestral sequence reconstruction. Dark blue bars show % conservation of all metabolic p-sites. Light blue bars show % conservation of all nonmetabolic p-sites. Red bars show % conservation of High Confidence (HC) metabolic p-sites. Orange bars show conservation of HC nonmetabolic p-sites.

