Figure 4.
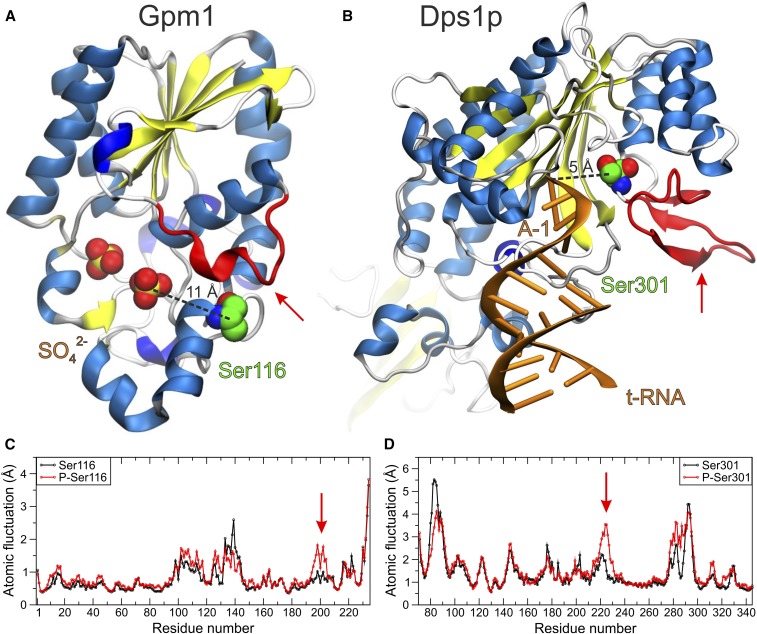
Molecular representations of two p-sites examined with molecular dynamic simulations in (A) the yeast phosphoglycerate mutase (Gpm1p) and (B) aspartyl-tRNA (transfer RNA) synthetase (Dps1p). The X-ray crystal structures of the enzymes are illustrated with cartoons colored by secondary structure and the p-site serine residues are shown with spheres (green C, red O, and blue N atoms). Distances between the p-sites and the catalytic active sites are indicated with dashed lines between Ser116 and a sulfate ion in Gpm1p [ Protein Data Bank identifier (PDB ID): 5pgm], and between Ser301 and adenine-1 (A-1) of tRNA in Dps1p (PDB ID: 1asy). The red arrows indicate regions close to the active sites of the enzymes that display altered dynamics upon phosphorylation. (C and D) Plots of the atomic fluctuations of the backbone Cα atoms extracted from 100-ns MD simulations of the native and phosphorylated enzymes.

