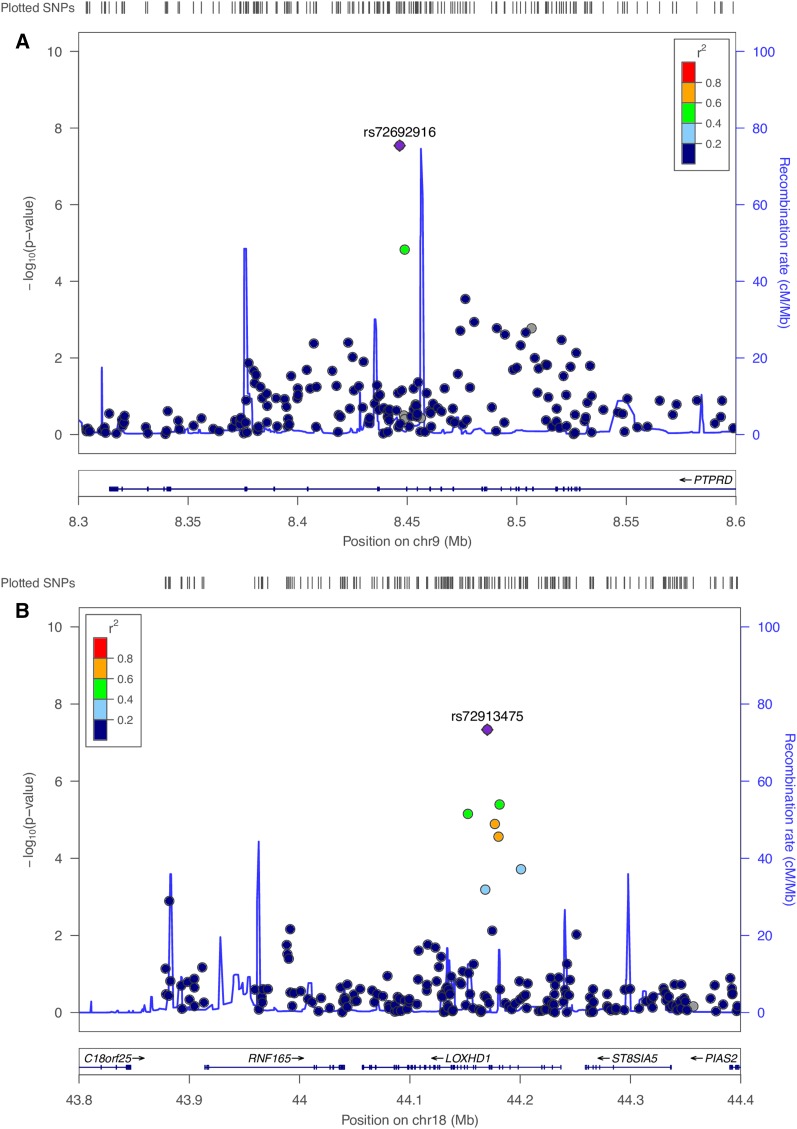
Figure 2.
Linkage disequilibrium regional genomic plot of fetal genome-wide associated SNPs with congener serum levels. (A) rs72692916 on chromosome 9p24.1 associated with PCB187 (β = −0.42, SE = 0.08, P = 2.8 × 10⁻⁸); maps to the PTPRD gene; (B) rs72913475 on chromosome 18q21.1 associated with BDE-100 (β = 0.55, SE = 0.1, P = 4.6 × 10⁻⁸) maps to the LOXHD1 gene. The X-axis represents the genomic position; the Y-axis shows the negative logarithm of the observed association P-value for each tested SNP. Plotted with Locuzoom tool (Pruim et al. 2011).

