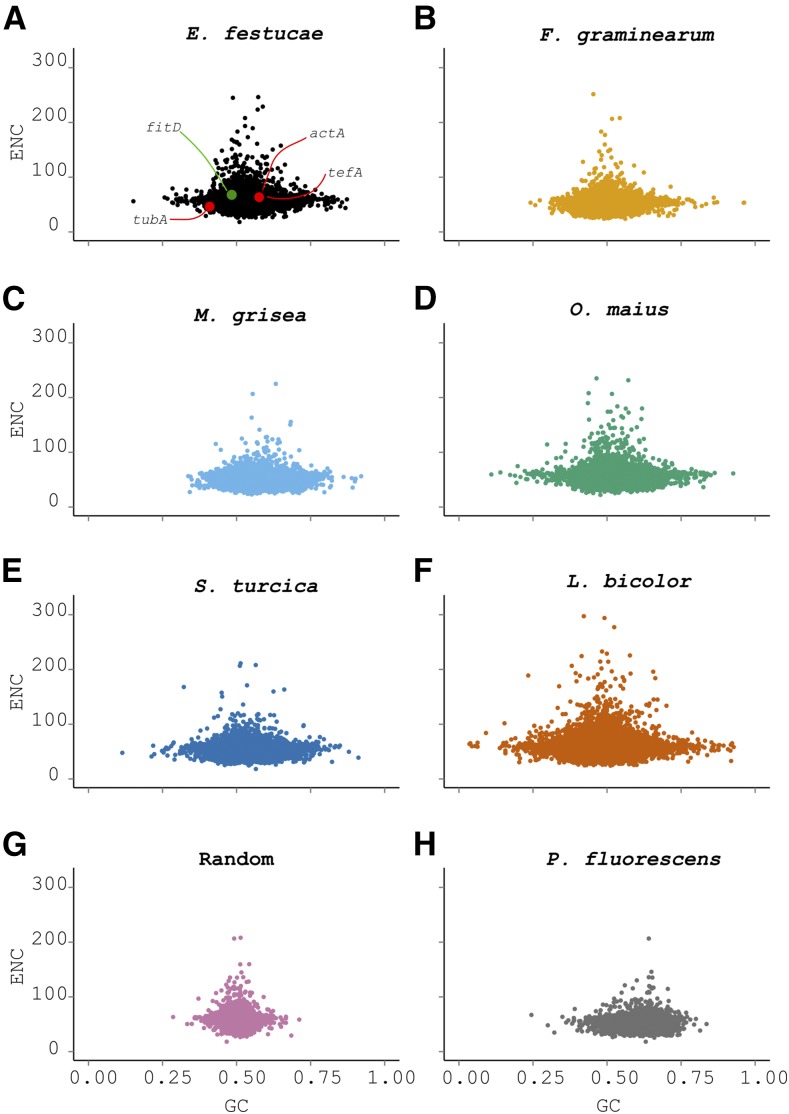
Figure 4.
Comparison of coding sequence compositions (ENC and GC) for species at laddered evolutionary distances from E. festucae. Scatterplots comparing GC content to ENC. All abscissa and ordinate axes are plotted using the same scales. (A) Comparison of GC and ENC for the reference species E. festucae. Housekeeping genes tubA, actA, and tefA are highlighted in red (actA and tefA points overlap), while the fitD putative laterally transferred gene from a Pseudomonas bacterium is shown in green. The fungal species F. graminearum (B), M. oryzae (C), O. maius (D), S. turcica (E), and L. bicolor (F) show a marked overlap with the E. festucae data. (G) Sequences with the same size as E. festucae coding sequences, starting with ATG and ending with the same stop codon, but otherwise containing random nucleotides are shown. For comparison, the sequence composition of the bacterium Ps. fluorescens is also presented in (H). actA, actin; ENC, effective number of codons; fitD, cytotoxin FitD; GC, GC content; tefA, translational elongation factor 1α; tubA, α-tubulin gene.

