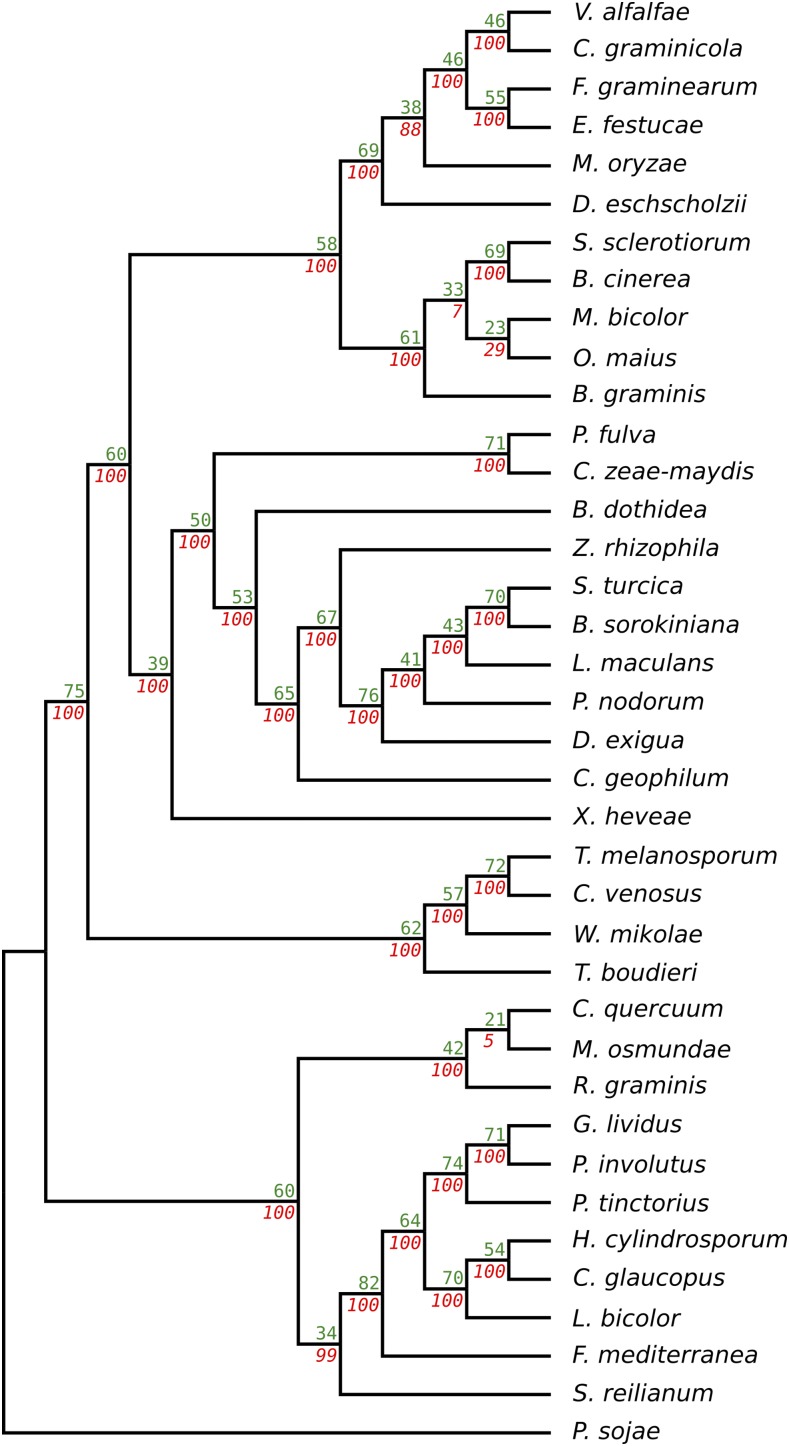
Figure 5.
Statistical support for the internal nodes of the species tree. The taxa in this species tree are the same as those presented in Figure 1 and are given in the same order. The numbers indicated over the branches (green) show the percentage of the bipartitions in the gene trees for the node to the right of the number. The numbers under the branches (red) show the corresponding bootstrap values. All trees were rooted using the oomycete outgroup P. sojae.

