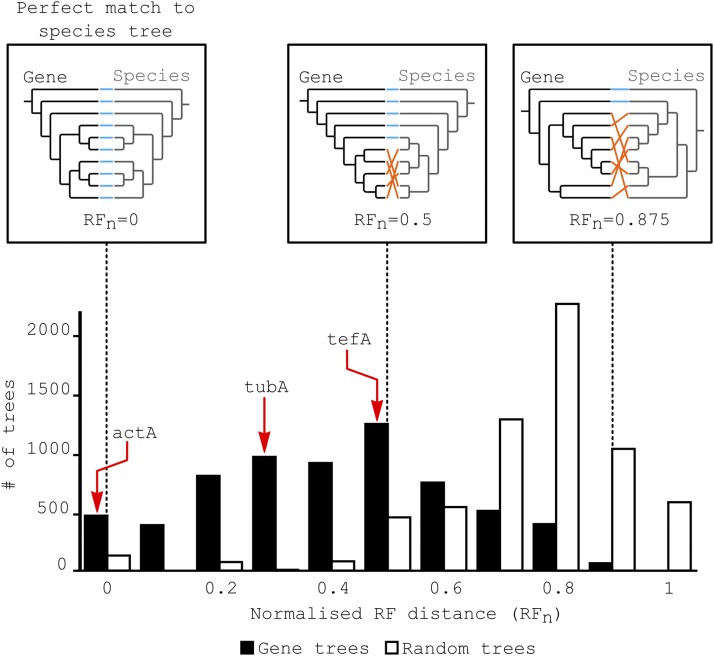
Figure 7.
Variation in the topology of gene trees compared to the species tree. The distribution of the RFns between the species tree and between the species tree and trees of individual E. festucae genes is shown in black. The distribution of the RFn distances between the species tree and randomly generated trees with the same size distribution as the real gene trees is displayed in white. The distance values for the housekeeping genes actA, tubA, and tefA are highlighted by red arrows. The fitD gene cannot be represented on this figure because it is only present in E. festucae. (This putative laterally transferred gene is not found in the other fungi studied here.) Examples of comparisons between gene trees and the species tree are displayed in the boxes at the top part of the figure. The species tree appears to vary only because the subset of species present in the gene tree differs between the three examples. The species tree topology is in fact identical for all analyses. Orange links indicate a change in the location of species in the gene tree relative to the species tree. Blue links indicate conservation with the species tree topology. RFn = 0 corresponds to a perfect match between the species tree and the gene tree, while RFn = 0.5 indicates that half of the nodes in the gene tree do not match the species tree. actA, actin; fitD, cytotoxin FitD; RFn, normalized Robinson and Foulds distances; tefA, translational elongation factor 1α; tubA, α-tubulin gene.

