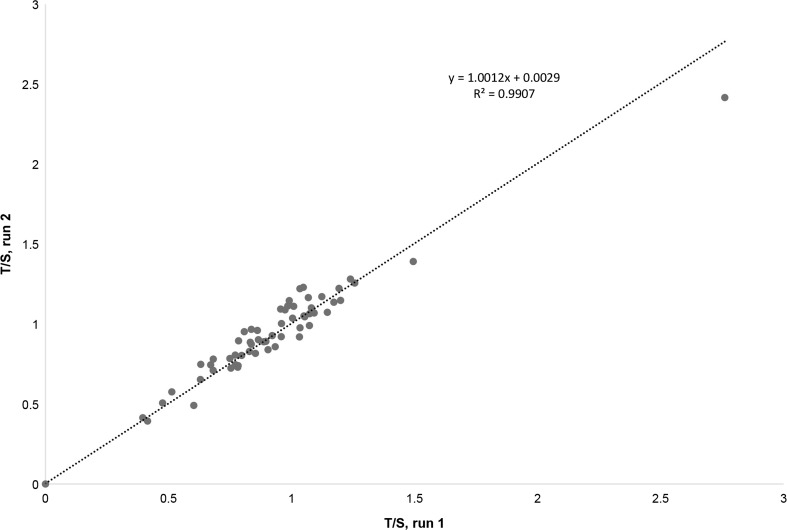
Fig. 3.
Relative telomere length measurements from two independent runs show reproducibility of qPCR assay. Plot represents the average telomere length obtained from two independent experiments performed using the same well positions. The linear regression equation and correlation coefficient (R 2) were generated using Microsoft Excel

