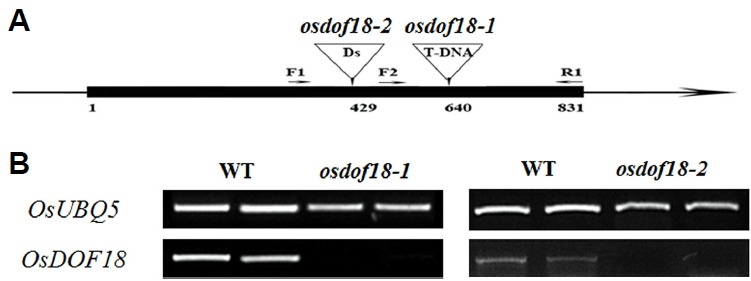
Fig. 1. Structure of OsDOF18 and position of T-DNA/Ds insertion.

(A) Positions of insertion mutants. Black boxes, exons; lines between boxes, introns. Arrows indicate primers for genotyping. (B) RT-PCR analyses of OsDOF18 expression levels.

(A) Positions of insertion mutants. Black boxes, exons; lines between boxes, introns. Arrows indicate primers for genotyping. (B) RT-PCR analyses of OsDOF18 expression levels.