
Fig. 4. Expression patterns of OsDOF18, OsAMT1;1, and OsNRT2;1 after plants were supplied with ammonium or nitrate.
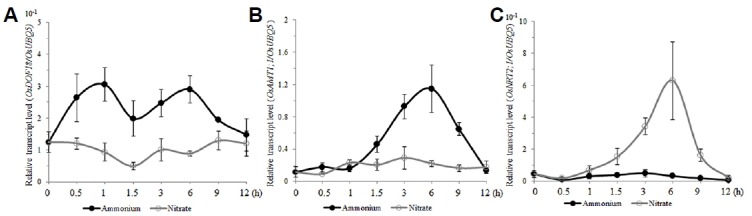
Quantitative RT-PCR analyses of transcript levels of OsDOF18 (A), OsAMT1;1 (B), and OsNRT2;1 (C) after ammonium or nitrate was supplied to 14 DAG seedlings grown in water. Expression levels were normalized to OsUBQ5. Closed circles, ammonium treatment; open circles, nitrate treatment. Error bars represent SE for at least 3 samples.