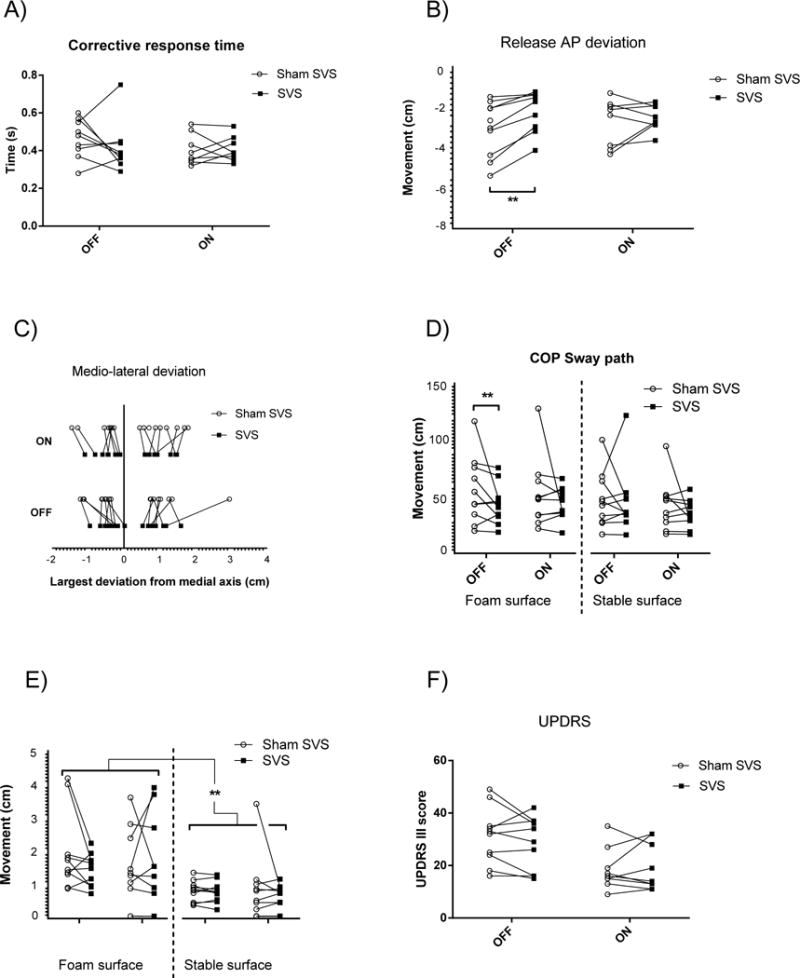
Figure 2. Posturography and UPDRS-III results.

Statistics given in Table 2; A) SVS shortened the response time (measure 1 in Fig. 1) from force release until the reactive centre of pressure (COP) movement had changed direction; B) Maximum anterioposterior (AP) centre of pressure (COP) deviation (cm) from the post release stable position (measure 3 in Fig. 1); C) COP deviations in the medio-lateral direction during the corrective response after force release were reduced during SVS (measure 4 in Fig. 1); D) total COP sway-path distance while standing with eyes closed during 10s of standing still on narrow support; E) the maximum sway deviation during 10s of standing still with eyes closed; F) UPDRS scores before and after LDOPA in the SVS and sham stimulation conditions. SVS=stochastic vestibular stimulation, OFF=no medication, ON=after 200 mg LDOPA. Post hoc test statistics: ** p ≤ 0.01.
