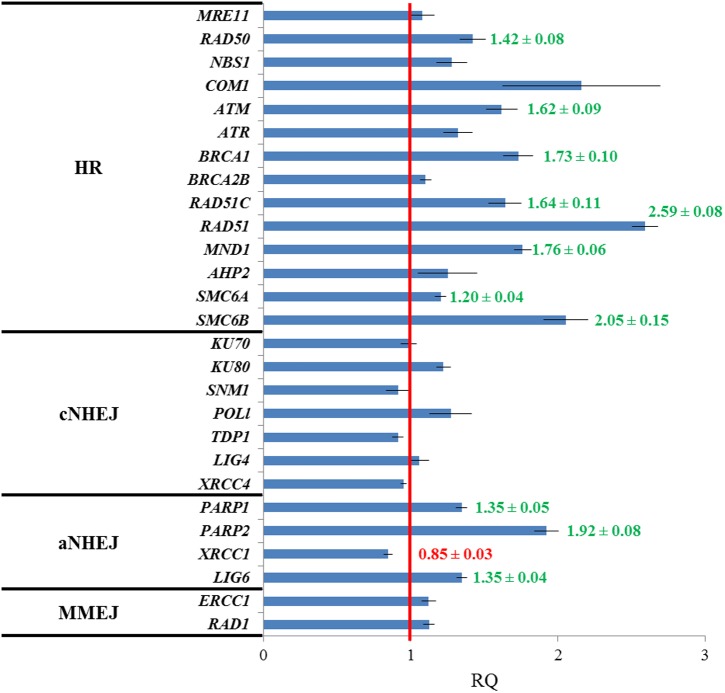
FIGURE 2.
Genes involved in HR and aNHEJ display different expression profiles in fas1-4 respect to WT seedlings. Values are the average of three technical replicates. The red line is the reference for the fold-change respect to the WT after normalization to ACTIN 2 expression. Genes analyzed have been grouped into four categories: HR, cNHEJ, aNHEJ, and MMEJ. Overexpressed genes are highlighted in green and the underexpressed gene appears in red. Numbers corresponding to fold-changes are only displayed for significant differences. RQ, relative quantity.

