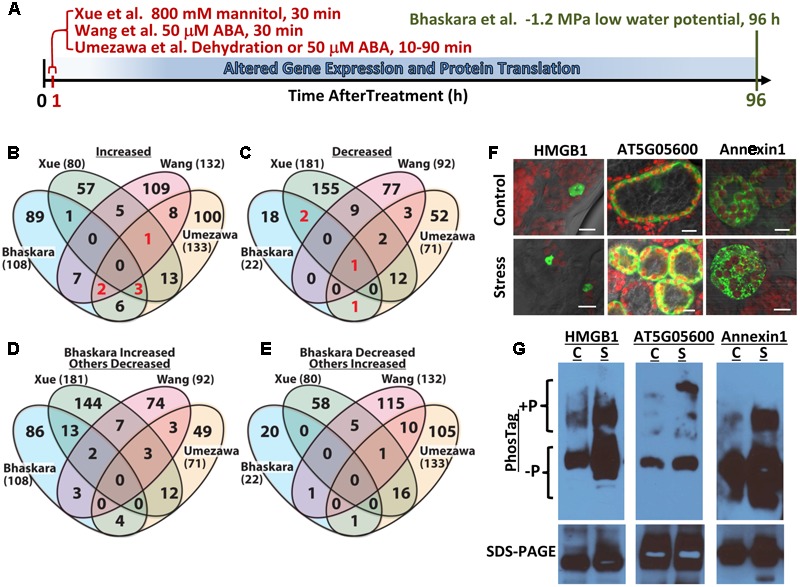
FIGURE 1.

Comparative analysis of four abiotic stress and ABA-related phosphoproteomic datasets and use of seedling transient expression and Phos-tag protein separation for exploratory analysis of phosphoproteins. (A) Diagram showing the different treatments and times of sample collection in the four phosphoproteomic studies compared here. Umezawa et al. (2013) analyzed 10–90 min dehydration or 50 μM ABA treatments and used a 3-fold cutoff to define phosphopeptides of altered abundance. Wang et al. (2013) used 50 μM ABA treatment for 30 min and used a 2-fold cutoff to define differentially regulated phosphopeptides. Xue et al. (2013) used 30 min treatment with 800 mM mannitol and a standard curve based approach combined with a 2-fold change cutoff to identify phosphopeptides of significantly altered abundance. Bhaskara et al. (2017) used 96 h low water potential treatment and P ≥ 0.05 combined with a 1.5-fold change cutoff. (B) Venn diagram comparing proteins with one or more phosphopeptide of increased abundance in stress or ABA treatment for all four datasets. Each data set is identified by the name of the first author and numbers in parentheses are the total number of proteins with increased phosphopeptide abundance in that dataset. Red numbers indicate phosphoproteins included in Table 1. (C) Comparison of proteins with one or more phosphopeptide of decreased abundance in stress or ABA treatment for all four datasets. Red numbers indicate phosphoproteins included in Table 1. (D) Converse comparison of proteins with increased phosphopeptide abundance in Bhaskara et al. (2017) versus proteins with decreased phosphopeptide abundance in the three other datasets. (E) Converse comparison of proteins with decreased abundance phosphopeptides in Bhaskara et al. (2017) versus proteins with increased phosphopeptide abundance in the three other datasets. (F) Transient expression of candidate proteins identified by Bhaskara et al. (2017) as having putative stress-induced phosphorylation. Each protein was expressed as a fusion with EYFP. All three proteins showed subcellular localization consistent with their predicted localization: nucleus for HMGB1; cytoplasmic for AT5G05600 and endomembrane for Annexin1. All panels show the merged image of EYFP (indicated by green color), chlorophyll fluorescence (indicated by red color) and bright field. Scale bars indicate 10 μm. (G) Phos-tag Gel and SDS-PAGE analysis of transiently expressed proteins followed by western blotting with anti-GFP. For each protein, Phos-tag gel separation followed by immunoblotting (upper images) detected increased abundance of slowly migrating bands in samples from stress-treated plants. This was consistent with low water potential-induced phosphorylation. SDS-PAGE followed by immunoblotting (lower images) confirmed the expression of a single form of each protein having the expected molecular weight of the native protein plus the 27 kd of EYFP (total molecular weight of 69 kD for AT5G05600, 63 kD for Annexin1 and 48 kD for HMGB1) and the equal loading of protein for control and stress treated samples. C, unstressed control; S, low water potential stress (–1.2 MPa for 96 h).
