Figure 2.

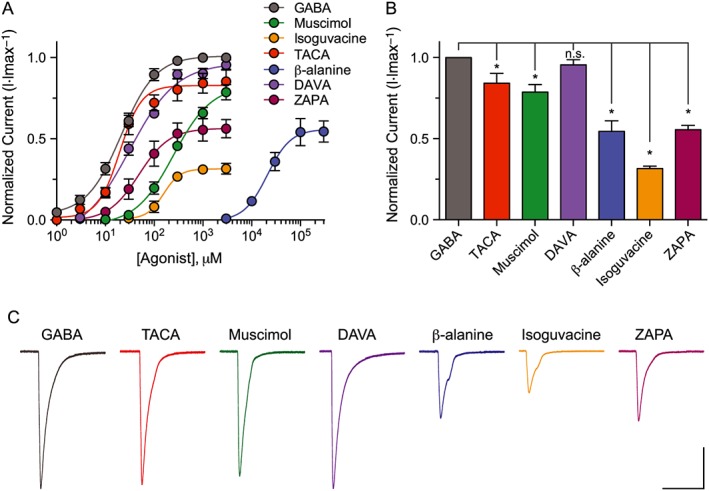
EXP‐1 is differentially activated by GABA agonists. (A) Dose–response curves comparing the responses of each agonist tested normalized to maximal GABA responses (3 mM) for EXP‐1. Oocytes were voltage clamped at −60 mV, and agonists were bath applied in series (1–3000 μM) for 5 s. Due to its low potency, β‐alanine was applied in series at higher concentrations (3–300 mM). Each data point represents the mean ± SEM with n ≥ 10 and N = 4. (B) Bar graph illustrating the efficacy of compounds tested relative to maximal GABA responses (3 mM). Each bar represents the mean ± SEM with n ≥ 10. n.s, not significant (P ≥ 0.05), *P ≤ 0.05; significantly different from GABA; one‐way ANOVA, Holm–Sidak post hoc test. (C) Representative current responses from an EXP‐1 expressing oocyte with each compound tested in series at maximal dose (3 mM; β‐alanine = 300 mM). Scale bar = 1 μA, 10 s.
