Figure 4.

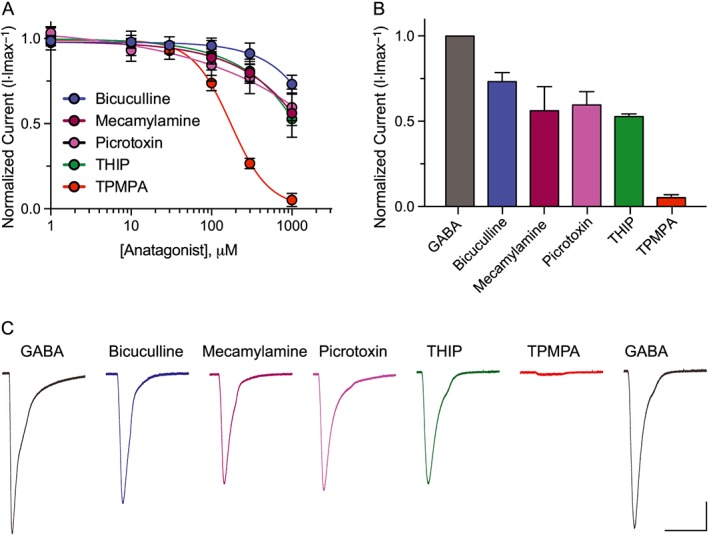
EXP‐1 is resistant to ionotropic GABA receptor antagonists. (A) Inhibitor dose–response curves were generated by applying GABA (10 μM) alone followed by GABA plus increasing concentrations of antagonist (10 μM GABA + 1–1000 μM antagonist). TPMPA was the only compound that potently inhibited EXP‐1 GABA‐induced currents (IC50 = 172 ± 7 μM). Responses were normalized to maximal GABA (10 μM) responses. Each data point represents the mean ± SEM with n ≥ 8 and N = 3. (B) Bar graph illustrating the efficacy of compounds tested (10 μM GABA + 1 mM antagonist) relative to maximal GABA only responses (10 μM). Each bar represents the mean ± SEM with n ≥ 8 and N = 3. (C) Representative current responses from an EXP‐1 expressing oocyte with each compound tested in series at maximal dose (10 μM GABA + 1 mM antagonist). GABA responsiveness fully recovers (2 min wash) after complete TPMPA inhibition. Scale bar = 0.5 μA, 10 s.
