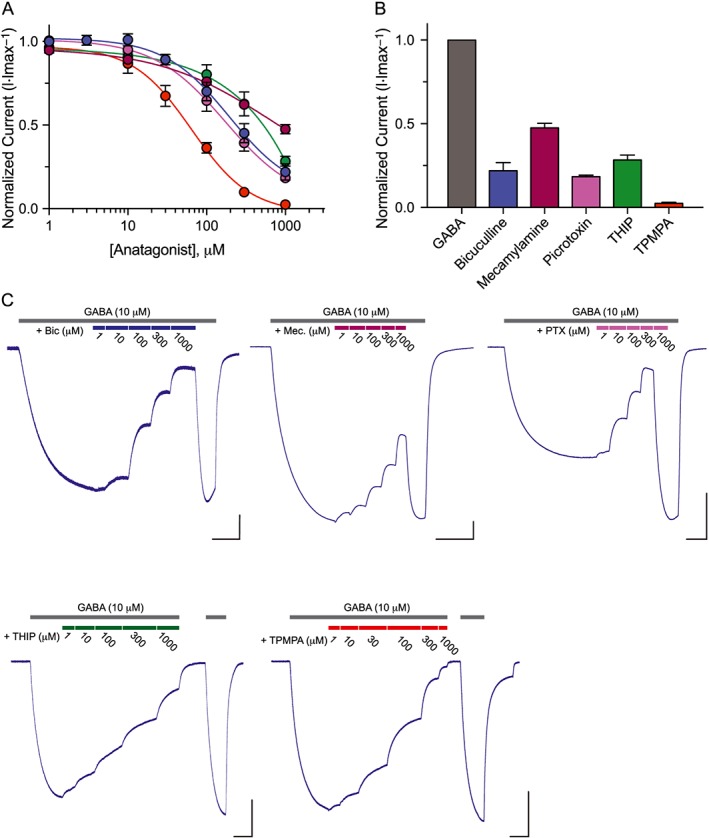
Figure 5.

LGC‐35 is sensitive to ionotropic GABA receptor antagonists. (A) Inhibitor dose–response curves were generated by applying GABA (10 μM) alone followed by GABA plus increasing concentrations of antagonist (10 μM GABA + 1–1000 μM antagonist). TPMPA was the most potent inhibitor of LGC‐35 GABA‐induced current (IC50 = 61 ± 4 μM). Responses were normalized to maximal GABA only responses. Each data point represents the mean ± SEM with n ≥ 7 and N = 3. (B) Bar graph illustrating the efficacy of compounds tested (10 μM GABA + 1 mM antagonist) relative to maximal GABA only responses (10 μM). Each bar represents the mean ± SEM with n ≥ 7 and N = 3. (C) Representative current responses of individual LGC‐35 expressing oocytes. GABA (10 μM) was applied until a steady‐state non‐desensitizing plateau was reached. Subsequently, increasing concentrations of antagonist (1–1000 μM antagonist) were applied in series in the presence of constant GABA (10 μM). The grey bars above each trace denote GABA application, and the coloured bars illustrate antagonist concentration co‐applications. GABA responsiveness fully recovers after the highest antagonist concentration block. Scale bar = 1 μA, 30 s.
