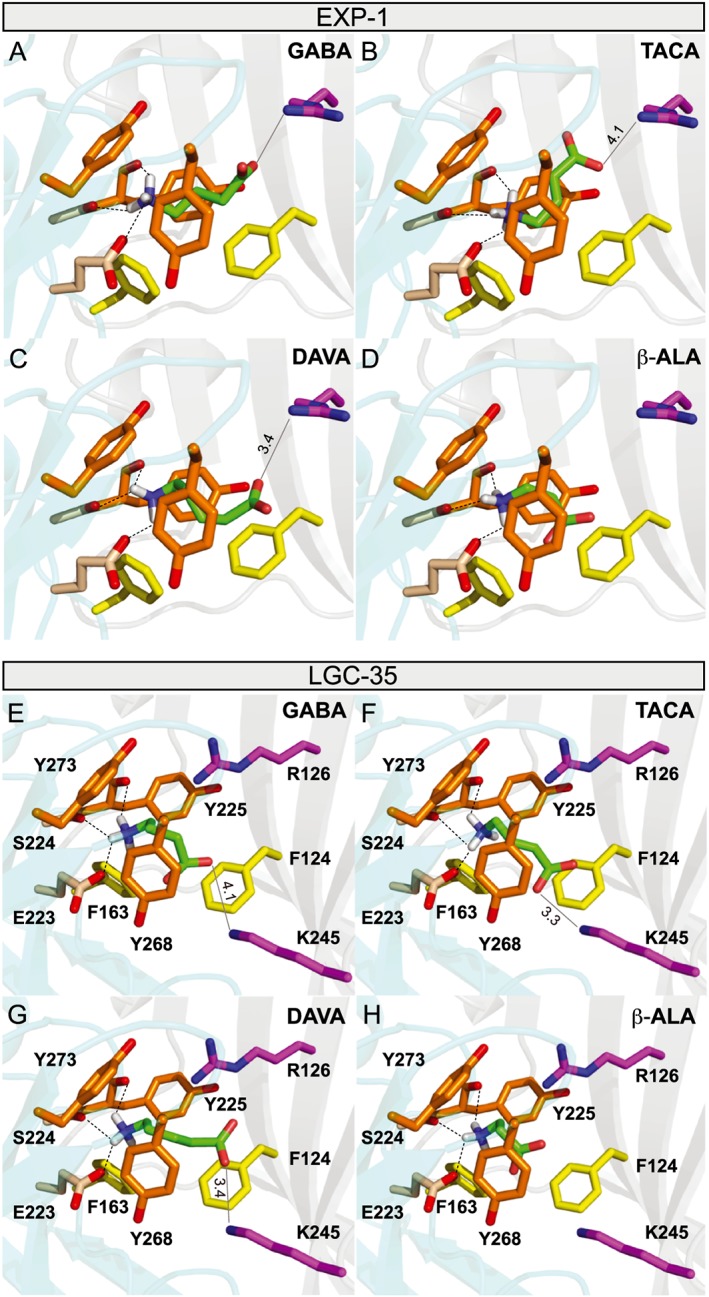
Figure 6.

Homology models of EXP‐1 and LGC‐35. (A–D) Molecular modelling of the binding modes of: (A) GABA, (B) TACA, (C) DAVA and (D) β‐alanine in the homology model of EXP‐1. The homology model of EXP‐1 was constructed based on the crystal structure of human GABA receptor, and the ligands were docked to the model with Autodock Vina software as described in the Methods section. Ligands are coloured green with oxygen labelled red and nitrogen blue. Dotted lines represent potential hydrogen bonds between ligand and receptor residues. Solid light grey line represents potential electrostatic interactions of the ligand carboxyl group with Arg126. Labelled distances are in angstroms. Unlabelled potential hydrogen bonds were less than 3.1 Å. Residues were numbered beginning at the start methionine. (E–H) Molecular modelling of the binding modes of: (A) GABA, (B) TACA, (C) DAVA and (D) β‐alanine in the homology model of LGC‐35. The homology model of EXP‐1 was constructed based on the crystal structure of human GABA receptor, and the ligands were docked to the model with Autodock Vina software as described in the Methods section. Ligands are coloured green with oxygen labelled red and nitrogen blue. Dotted lines represent potential hydrogen bonds between ligand and receptor residues. Solid light grey line represents potential electrostatic interactions of the ligand carboxyl group with Lys 245. Labelled distances are in angstroms. Unlabelled potential hydrogen bonds were less than 3.2 Å. Residues were numbered beginning at the start methionine.
