Figure 8.

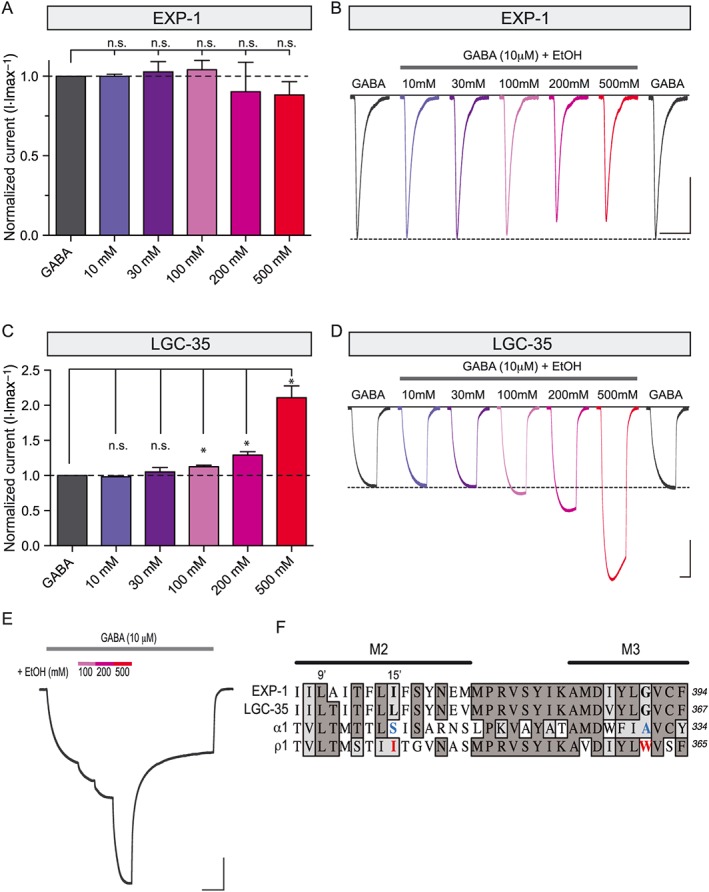
LGC‐35 is selectively potentiated by ethanol. (A) EXP‐1 is neither significantly potentiated nor inhibited by ethanol. Current responses of co‐applied ethanol (10 μM GABA + 10–500 mM ethanol) were normalized relative to maximal GABA only responses (10 μM). For each oocyte, an initial stable GABA response was first achieved. Subsequently, co‐application of 10 μM GABA + increasing concentrations of ethanol were bath applied for 5 s, followed by a 2 min wash. Each bar represents the mean ± SEM with n ≥ 8 and N = 3. (B) Representative current responses from an EXP‐1 expressing oocyte with co‐application of increasing concentrations of ethanol. Scale bar = 0.5 μA, 10 s. (C) LGC‐35 is potentiated by high concentrations of ethanol. Current responses of co‐applied ethanol (10 μM GABA + 10–500 mM ethanol) were normalized relative to maximal GABA only responses (10 μM). For each oocyte, an initial stable GABA response was first achieved. Subsequently, co‐application of 10 μM GABA + increasing concentrations of ethanol were bath applied until a plateau was reached, followed by a 2 min wash. LGC‐35 current responses are significantly potentiated by high concentrations of ethanol (100–500 mM). Each bar represents the mean ± SEM with n ≥ 8 and N = 3. n.s, not significant (P ≥ 0.05), *P < 0.05; One‐way ANOVA with Holm–Sidak post hoc test. (D) Representative current responses from an LGC‐35 expressing oocyte with co‐application of increasing concentrations of ethanol. Note, GABA responsiveness is unchanged compared with initial GABA‐only responses after increasing series of ethanol exposure. Scale bar = 0.5 μA, 30 s. (E) Representative current responses from an LGC‐35 expressing oocyte. GABA (10 μM) was applied until a steady‐state non‐desensitizing plateau was reached. Subsequently, increasing concentrations of ethanol (100–500 mM) were applied in series in the presence of constant GABA (10 μM). The grey bars above each trace denote constant GABA exposure, and the coloured bars illustrate ethanol concentration co‐applications. Scale bar = 1 μA, 60 s. (F) Comparative sequence alignment of transmembrane domains 2 and 3 (M2 and M3), highlighting key residues that confer differential ethanol sensitivity (blue) and resistance (red) in the human α1 and ρ1 receptor subunits respectively. Dark grey shading marks amino acid identity, and light grey shading shows similarity.
