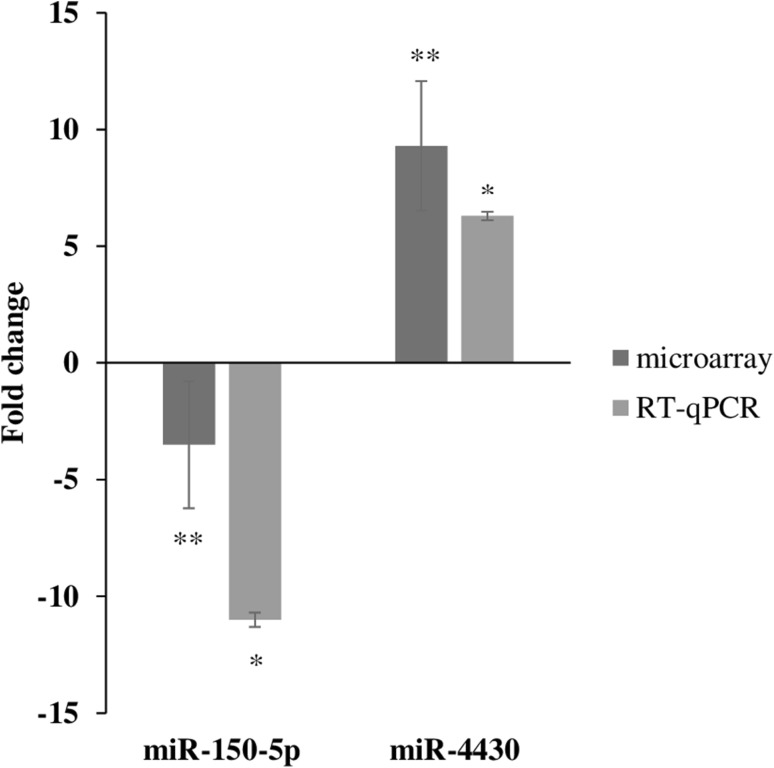
Fig. 1.
Verification of miRNA expression by RT-qPCR. The miR-150-5p and miR-4430 were down-regulated and up-regulated, respectively in MM compared to the controls. Importantly, the fold changes cannot directly compared between assays due to differences in calculation methods, but the general trend of up-regulation and down-regulation can be compared. Error bars represent the standard deviation of the mean (SD). *p < 0.001; **p < 0.05

