
Fig. 3.
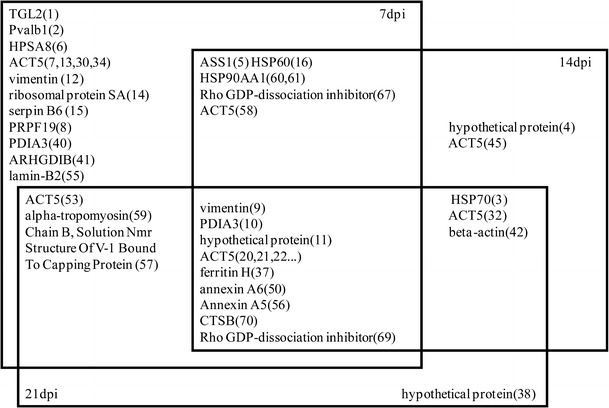
Venn diagram summarizing the spots that were significantly differentially expressed in the spleen tissues of REV-infected chickens according to their corresponding time of sampling. The identities of spots that were commonly expressed were placed in overlapping areas accordingly. The corresponding spot numbers are shown in parentheses. Refer to Table 1 for the respective protein names