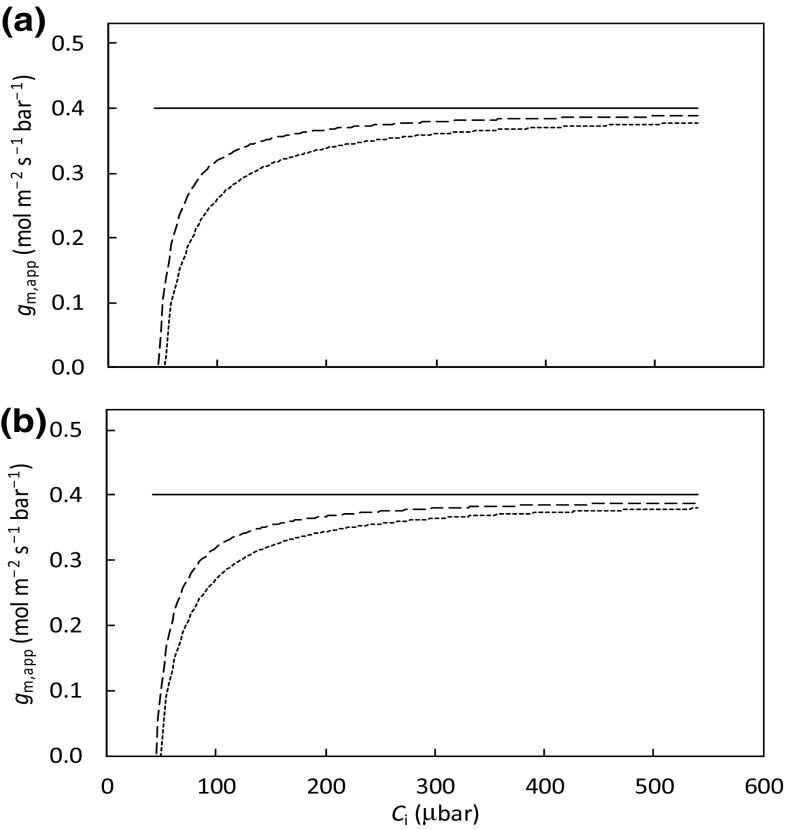
Fig. 3.
Simulated apparent mesophyll conductance (g m,app) as a function of C i, under ambient O2 condition: a for three values of σ (solid line for σ = 1, long-dashed line for σ = 0.5 and short dash line for σ = 0) if parameter ω stays constant at 0.5 and b for three values of ω (solid line for ω = 0, long-dashed line for ω = 0.5 and short-dashed line for ω = 0.9) if parameter σ stays constant at 0.5. The value of J used for simulation was 125 μmol m− 2 s− 1. Other parameter values as in Fig. 2. Simulation used the method as described in Appendix A

