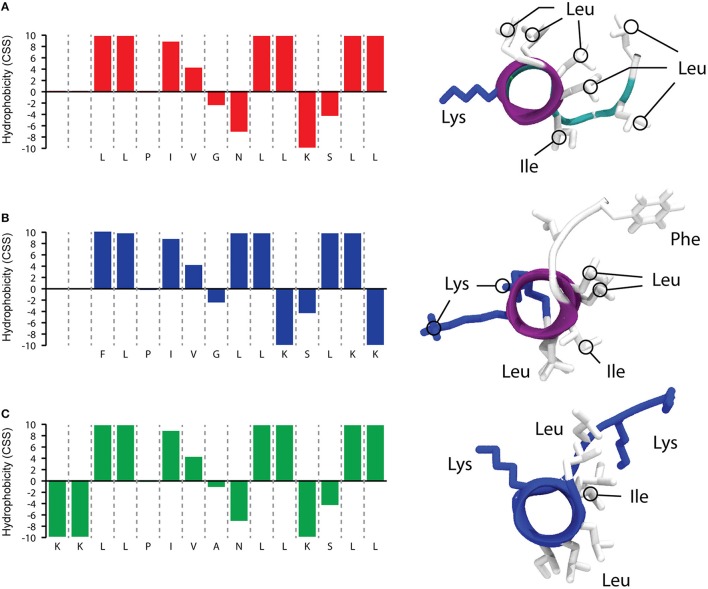
Figure 1.
Predictive simulations of hydrophobic profile and 3D structure of TB (A), TB_L1FK (B), and TB_KKG6A (C). The hydrophobic profile calculated with the combined consensus scale (CCS) is schematized on the left side (Maccari et al., 2013). 3D structures (right side of the figure) were calculated with PEP-FOLD3 (Lamiable et al., 2016); the distribution of hydrophobic and charged residues is highlighted.

