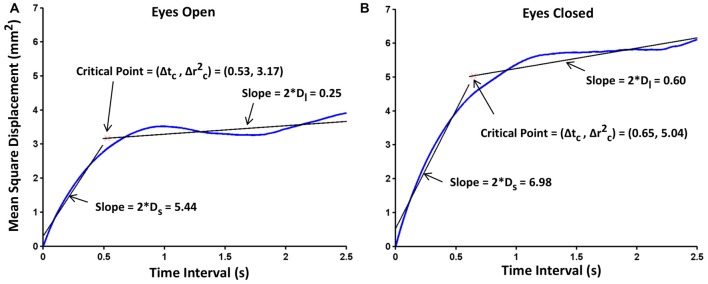
Figure 3.
Exemplar stabilogram-diffusion plots for one subject, under (A) EO and (B) EC conditions. The straight lines in black, fitted to the short- and long-term regions are used to estimate the stabilogram-diffusion parameters. Diffusion coefficients, critical mean square displacements and critical time intervals are also shown on the plots. Hurst exponentials were obtained by corresponding log-transformations of these plots.

