Figure 5.

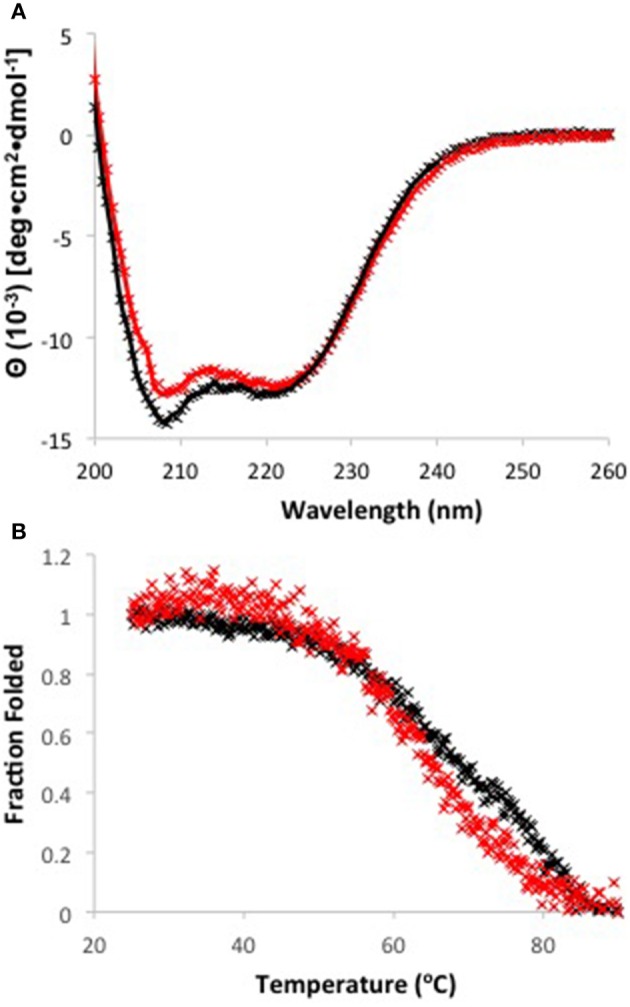
(A) Circular dichroism spectra for apo Zur in the absence (black) and presence (red) of 15 μM Zn. Data points are shown as (x) and fits are shown as solid lines. (B) Melt curves measured at 208 nm for apo (black) and holo (red) Zur.

(A) Circular dichroism spectra for apo Zur in the absence (black) and presence (red) of 15 μM Zn. Data points are shown as (x) and fits are shown as solid lines. (B) Melt curves measured at 208 nm for apo (black) and holo (red) Zur.