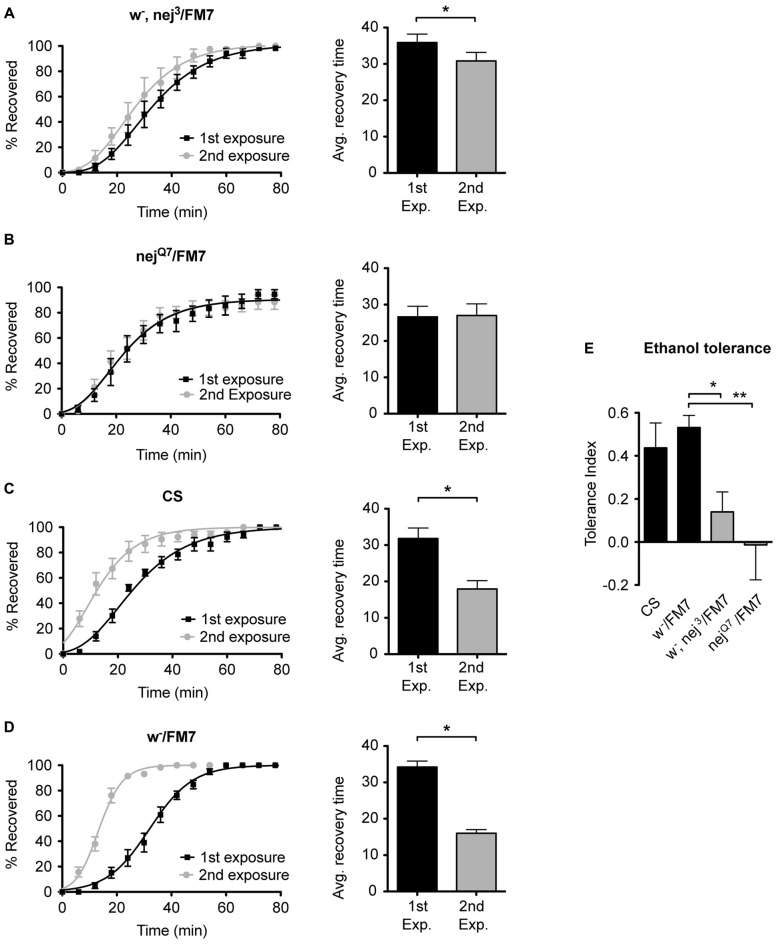
Figure 5.
Mutations in the nejire gene reduce the capacity for ethanol tolerance. Recovery curves from ethanol sedation, and the respective average recovery times, for nej3 heterozygous flies (A) and nejQ7 heterozygous flies (B), the WT Canton-S (C) and the w-/FM7 background control flies (D). In each recovery curve graph, the black curve represents recovery from a first ethanol treatment (1st exposure), whereas the gray curve represents recovery from a second ethanol treatment (2nd exposure). For each fly strain, the average recovery time of animals after the first ethanol treatment (1st exp.) or after a second ethanol treatment (2nd exp.) are shown to the right of each panel. Error bars represent SEM (Student’s t-test: *denotes P < 0.05, n > 31). The difference in recovery times for all strains is depicted as the tolerance index (E) for the heterozygous nej3 or nejQ7 mutant alleles in comparison to the Canton S or w-/FM7 control flies. Error bars represent SEM (One-way ANOVA w/Dunnett post test: *denotes P < 0.05; **denotes P < 0.01; n = 58 [w-/FM7], 48 [w-, nej3/FM7], 31 [nejQ7/FM7], 51 [CS]).

