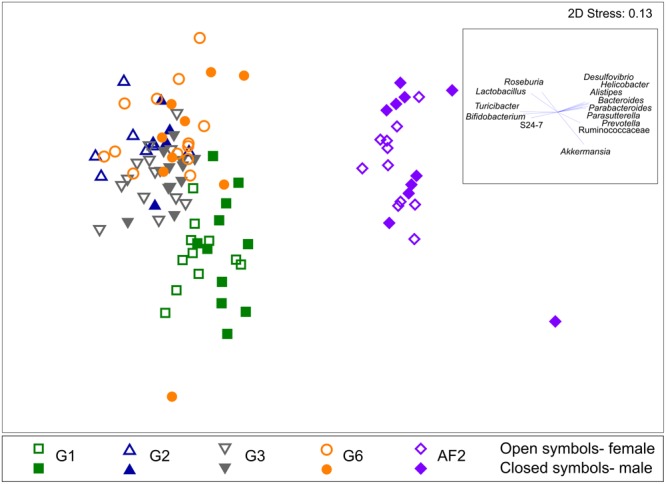
FIGURE 2.

Non-metric multidimensional scaling (NMDS) ordination plot of the fecal microbiota. NMDS plot was generated based on the Bray–Curtis distances of the fecal microbiota of C57BL/6J inbred mice from the founder (G1), second (G2), third (G3), and sixth (G6) generation within a single facility, and the same strain of mice from a separate animal facility, AF2. Mice from the different generations and facility and mice sex are labeled as indicated. Bacterial taxa that contributed to the differences between the mice groups are shown as vectors based on a Spearman correlation of >0.4, with the corresponding weight and direction shown in the box inset.
