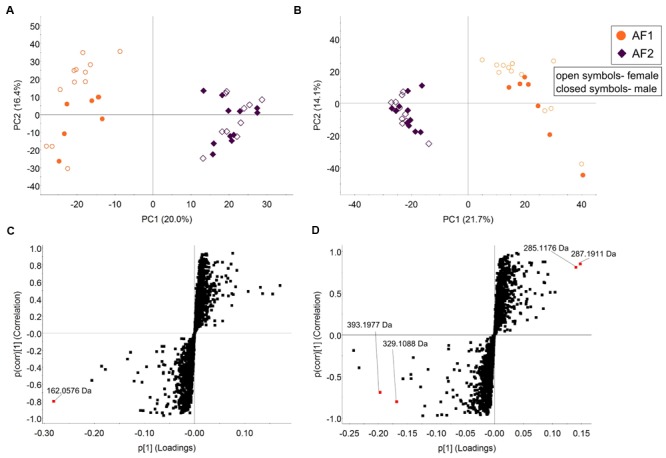
FIGURE 8.

Fecal metabolome analysis of C57BL/6J mice between two animal facilities. Unsupervised PCA analysis of fecal samples of C57BL/6J mice from two different animal facilities in the (A) positive- and (B) negative ion mode. The open and closed symbols represent female and male mice, respectively. S-plots were generated from OPLS-DA analysis of (C) positive and (D) negative markers, with the discriminant markers between the groups as labeled (Model fit: R2Y = 0.91, Q2 = 0.66 for positive ionization mode and R2Y = 0.96, Q2 = 0.83 for negative ionization mode).
