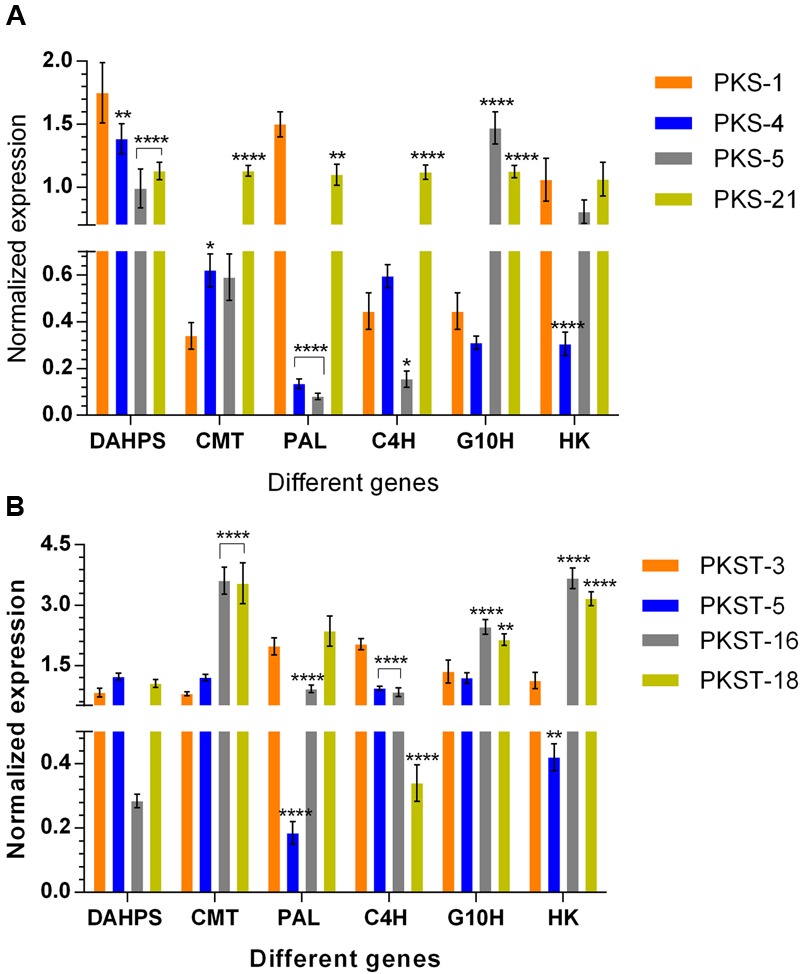
FIGURE 6.

Expression profiling of selected genes in different tissues of P. kurroa accessions; (A) shoots and (B) stolons. Expression values were normalized with levels of 26S reference gene. The data presented as means ± SD (n = 3). Significance was evaluated for each gene between different accessions (∗p < 0.05, ∗∗p < 0.01, ∗∗∗∗p < 0.0001).
