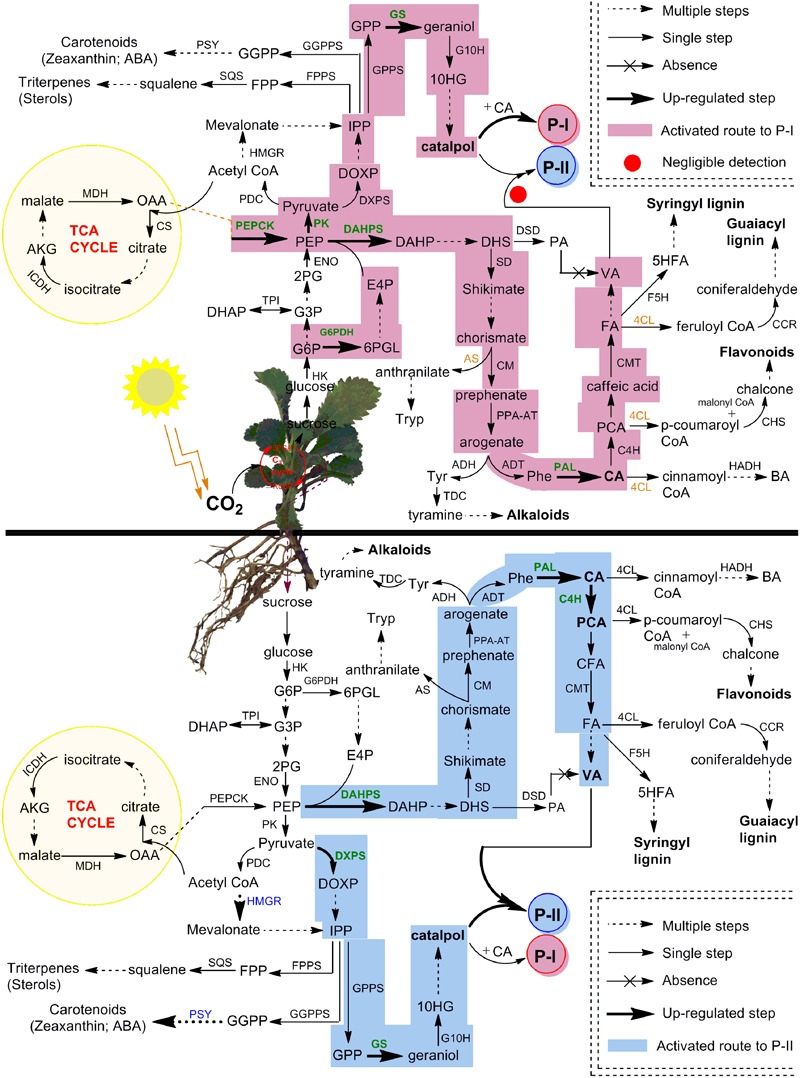
FIGURE 8.

Complete framework of metabolic network depicted P-I and P-II biosynthesis in different compartments of P. kurroa. The established routes of P-I and P-II production were presented with different colors to highlight the modulations in shoots and stolons tissues of P. kurroa. Up-regulated gene expressions were highlighted with bold and green color. The abbreviations are elaborated in Supplementary Table 3.
