
FIGURE 4.
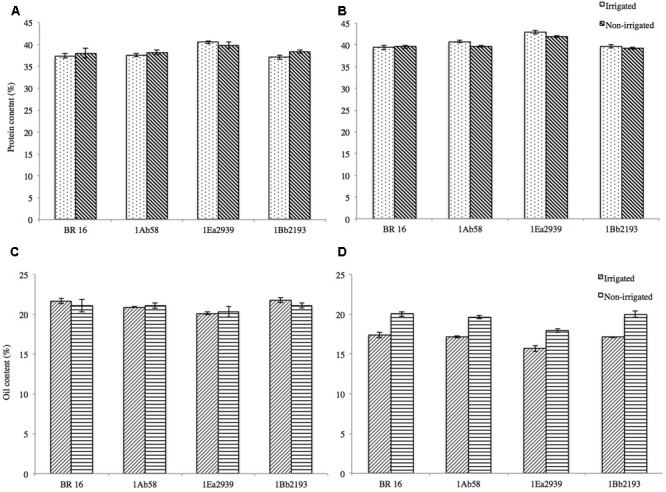
Protein (%) and oil (%) content in soybean GM lines 1Ab58, 1Bb2193, and 1Ea2939 and WT plants (BR 16 cultivar) subjected to irrigated (IRR) and non-irrigated (NIRR) treatments under field conditions. (A,C) Data from crop season 2013/2014. (B,D) Data from crop season 2014/2015. Values represent mean ± standard error; n = 4 replicates.