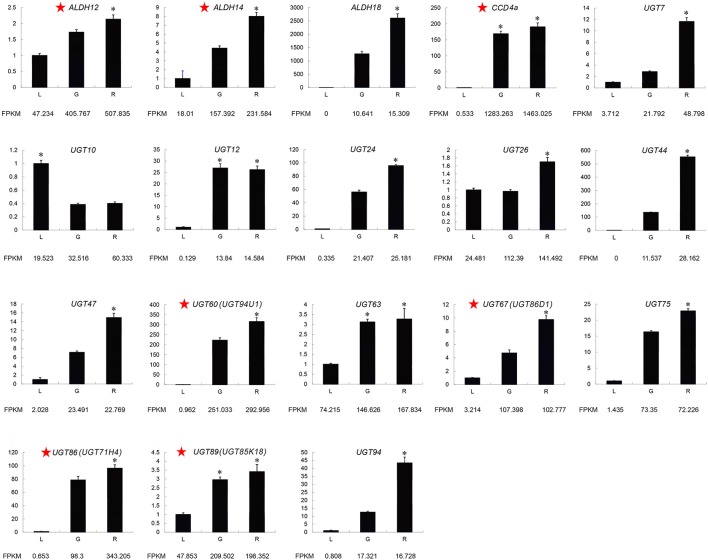
Figure 3.
Expression of candidate crocin biosynthesis genes related to crocin biosynthesis determined by qRT-PCR. The characters on the X-axis indicate the leaves (L), green fruits (G), and red fruits (R). The Y-axis represents the fold changes in gene expression. The actin gene was used as an internal reference. The red star next to gene names represents the most likely to be involved in crocin biosynthesis. One-way ANOVA was performed using IBM SPSS 20 software. Asterisks represents significant differences from this comparison. P < 0.01 was considered highly significant.

