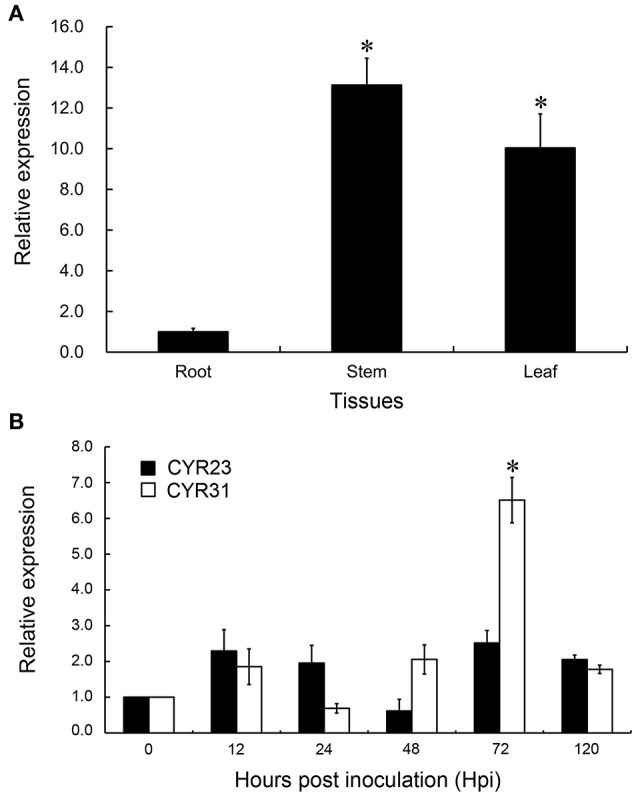
Figure 3.

Transcript profiles of TaDIR1-2 in different wheat tissues and in wheat leaves in response to virulent and avirulent Pst races (A) Samples were collected from leaves, stems and roots. (B) Wheat leaves were sampled for CYR23- and CYR31- inoculated and mock-inoculated plants at 12, 24, 48, 72, and 120 hpi and, additionally, the mock-inoculated at 0 hpi. Results are shown as means ± standard deviation of three biological replications. Relative gene quantification was calculated by the comparative ΔΔCt method. Data were normalized to the expression level of the wheat elongation factor TaEF-1α (GenBank accession no. Q03033). Asterisks indicate a significant difference (P < 0.05) from the root (A) and from 0 hpi (B) by Student's t-test.
