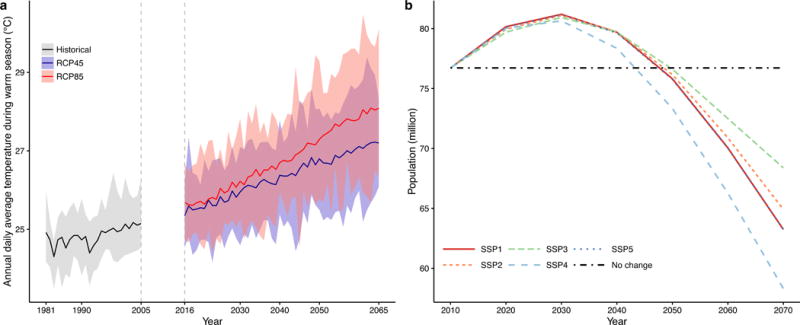
Fig.1.

Temperature and population changes in the 104 counties of Jiangsu Province. (a) multi-model simulated time series of annual warm season (May to September) mean daily average temperature during the historical period (1981–02005) and future periods (2016–2065). Time series of mean projections and a measure of uncertainty (shading, minimum-maximum range from 21 CMIP5 GCMs) are shown for RCP4.5 (blue) and RCP8.5 (red). Black (grey shading) is the modelled historical daily average temperature. See Supplementary Table A1 for summary information on each model. (b) The total population projections during 2010–2070 under six population scenarios (No change and SSP1-SSP5).
