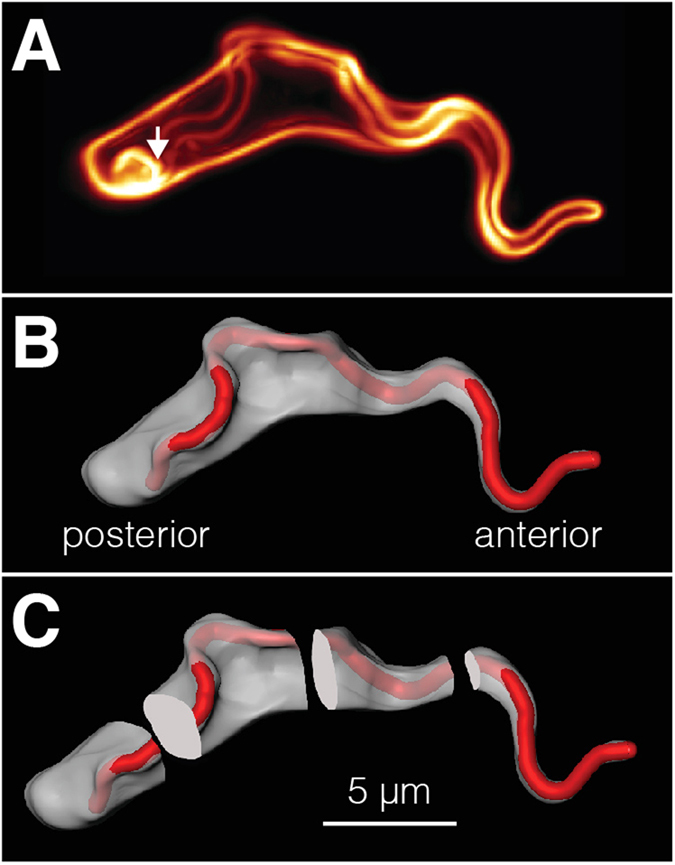
Figure 6.

Determination of trypanosome cell surface areas. a) The measurement of surface areas was done using high-resolution 3D fluorescence microscopy as described19. The arrow indicates the position of the flagellar pocket. b) Based on the 3D-data set a volume model was rendered using the AMIRA software package (FEI). Red colour indicates the flagellar surface and the cell body membrane is displayed in grey. c) The trypanosome surface model was digitally divided into four sections of 5 μm length each and the surface areas of these sections were calculated individually.
