
Figure 5.
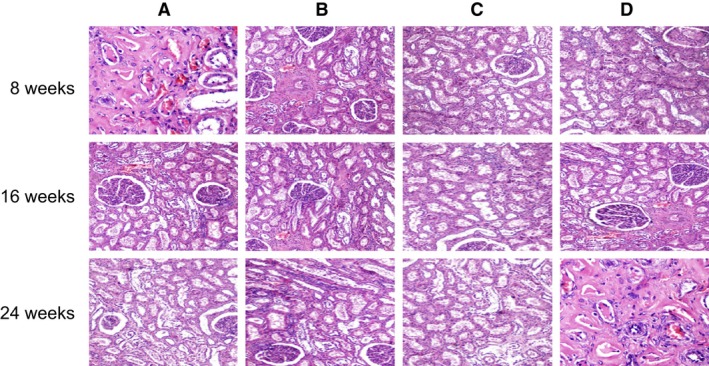
Histopathological observation of mice tissues in each group (400×). The arrows indicate the infiltration of inflammatory cells; (A), MRL‐LPr/LPr mice, feeding with 1,25(OH)2D3; (B), MRL‐LPr/LPr mice, VDR‐knock‐in and feeding with 1,25(OH)2D3; (C), normal mice, feeding without 1,25(OH)2D3; (D), normal mice, VDR‐knockout and feeding without 1,25(OH)2D3.