Figure 3.

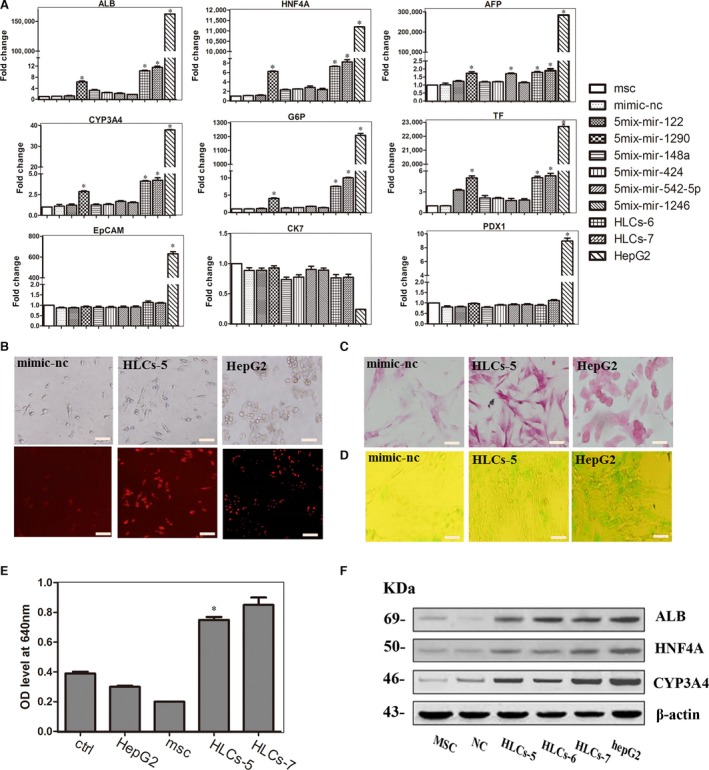
Effects of transfecting hMSCs with the five‐miRNA combination. (A) The expression levels of the following hepatocyte‐specific genes were determined by qPCR at day 7: ALB, HNF4A, AFP, CYP3A4, TF, G6P, PDX1, EpCAM and CK7. The data are presented by mean ± S.E.M. (n = 3), compared with mimic‐nc, *P < 0.05, ***P < 0.001 by Student's t‐test. (B) LDL uptake ability of HLC‐5, the scale bar is 200 μm. (C) PAS staining is used to measure the glycogen store ability of HLC‐5, the scale bar is 100 μm. (D) ICG uptake analysis of HLC‐5, the scale bar is 200 μm. (E) Analysis of BUN synthetic ability of HLC‐5, the data were represented by mean ± S.D. (n = 3), compared with control, *P < 0.05 by Student's t‐test. (F) Hepatocyte‐specific gene expression at protein level was analysed by Western blotting.
