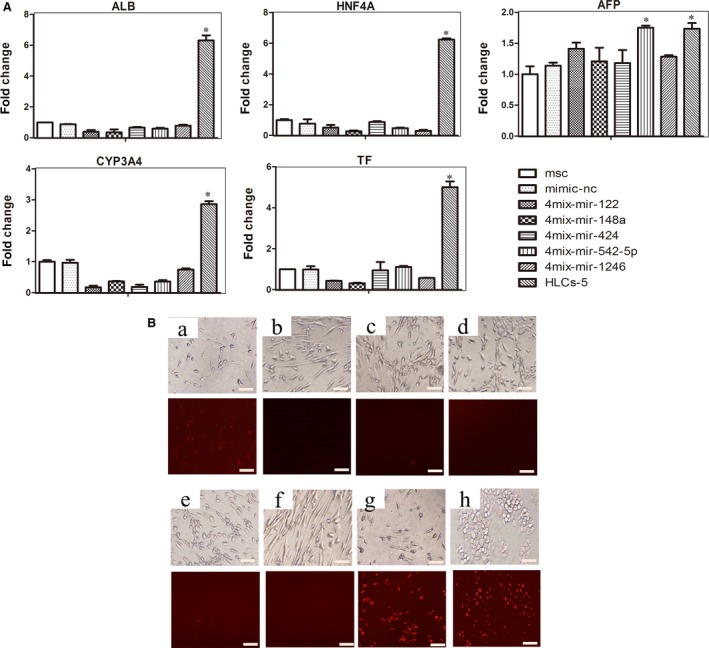
Figure 4.

Effects of four‐miRNA combination on hMSCs. (A) Liver marker genes expression analysed by qPCR at day 7: ALB, AFP, HNF4A, CYP3A4 and TF. The data were represented by mean ± S.E.M (n = 3), compared with mimic‐nc, *P < 0.05, ***P < 0.001 by Student's t‐test. (B) Analysis of LDL uptake ability at day 7: a) mimics‐nc; b) 4mix‐without‐miR‐122; c) 4mix‐without‐miR‐148a; d) 4mix‐without‐miR‐424; e) 4mix‐without‐miR‐542‐5p; f) 4mix‐without‐miR‐1246; g) HLC‐5; h) HepG2, the scale bar is 200 μm.
