
Figure 1.
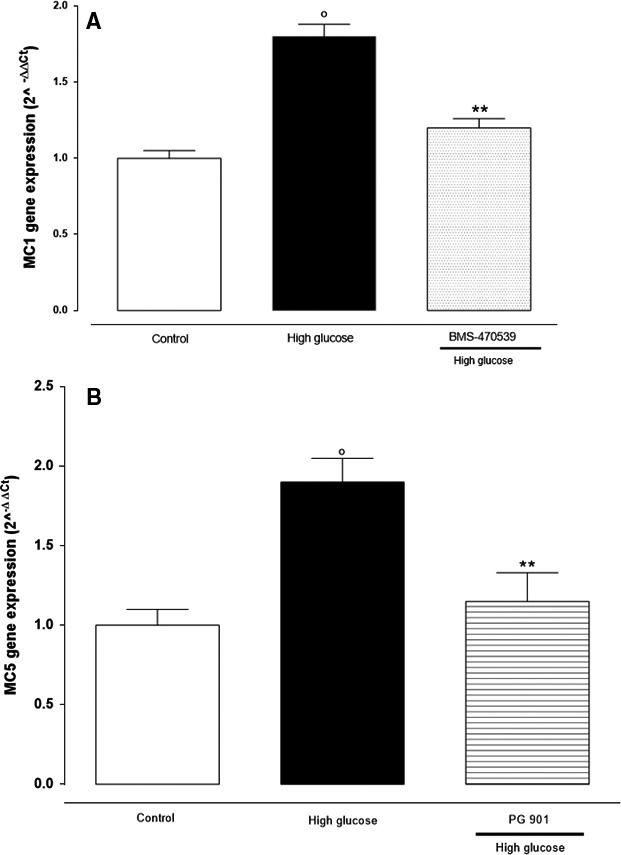
RT‐PCR analysis showed (A) MCR 1 (melanocortin receptors 1) and (B) MCR 5 (melanocortin receptor 5) gene expression in retinal cells cultured in high‐glucose (25 mM) concentration, and in the presence or absence of MCR 1 agonist BMS‐470539 and MCR 5 agonist PG‐ 901. The results are reported as the mean ± S.E.M. of n = 3 treatments and the significant results expressed as °P < 0.01 versus control and **P < 0.01 versus high glucose.