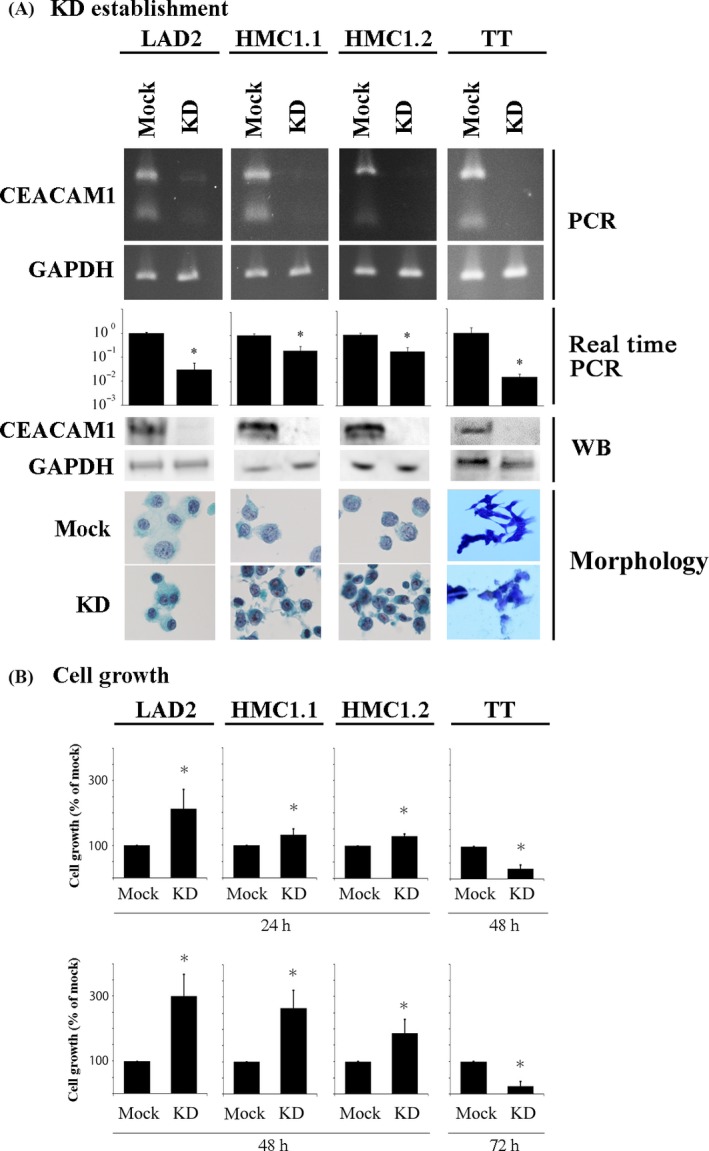
Figure 3.

CEACAM1 knockdown enhances cell growth of LAD2, HMC1.1 and HMC1.2 cells, but suppresses that of TT cells. (A) Establishment of CEACAM1‐knockdown LAD2, HMC1.1, and HMC1.2 and TT cells. Reverse transcription PCR, real‐time PCR (relative copy numbers), Western blotting, and morphology (LAD2, HMC1.1 and HMC1.2 cells; Papanicolaou staining, TT cells; Diff‐Quik stain). (B) The CCK‐8 kit was used for the evaluation of the cell growth of CEACAM1‐knockdown or mock LAD2, HMC1.1, HMC1.2 and TT for the indicate time (n = 3, respectively). *P < 0.05, when compared with the value of mock cells.
