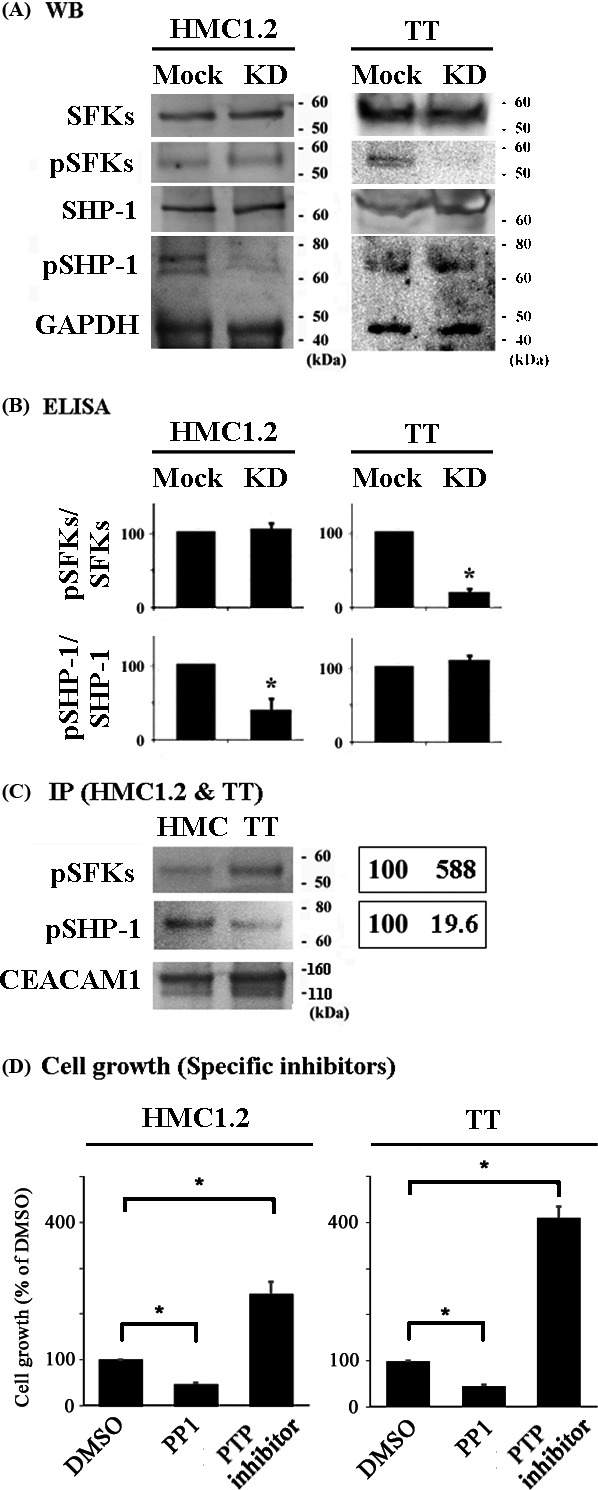
Figure 4.

Activated SHP‐1 is preferentially associated with CEACAM1 in HMC1.2 cells, whereas activated SFKs are preferentially associated with CEACAM1 in TT cells. The phosphorylation status of SFKs and SHP‐1 in CEACAM1‐knockdown and mock HMC1.2 or TT cells. Western blotting. Data are representative of three individual experiments. (B) ELISA for phospho‐SHP‐1 or phospho‐SFKs in HMC1.2 or TT cells. Relative values when the values of mock cells are 100. *P < 0.05, when compared with the value of mock cells. (C) The interaction of SFKs or SHP‐1 with CEACAM1 in HMC1.2 and TT cells. Left panel: Immunoprecipitation. Right panel: the average of relative values of the band intensities in the blots (n = 3), when the band intensities of HMC1.2 are normalized to 100. (D) The CCK‐8 kit was used for the evaluation of the effect of the specific inhibitor for SFKs PP1 and the specific inhibitor for SHP‐1 PTP inhibitor I on the cell growth of HMC1.2 (24 h) and TT (48 h) (n = 3, respectively). *P < 0.05, when compared with the value of mock cells.
