
Figure 4.
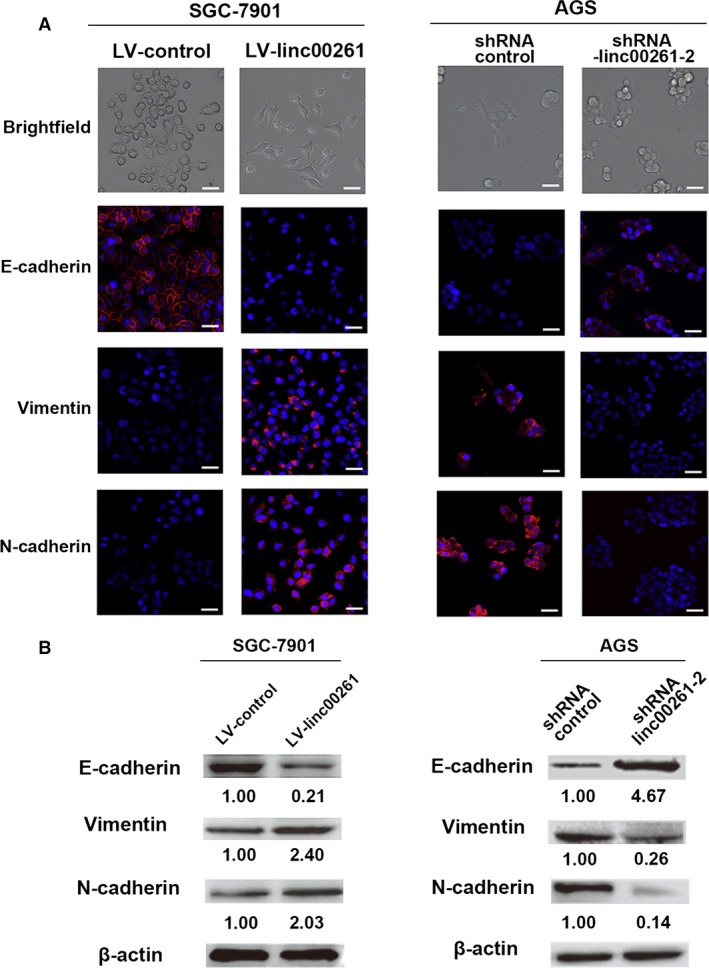
linc00261 suppresses EMT in GC cells. (A) Immunofluorescence images for EMT markers of linc00261‐overexpressing or control SGC7901 cells. Scale bar, 20 μm. Western blot analysis of phenotypic markers after linc00261 overexpression (SGC7901). (B) Immunofluorescence images for EMT markers of linc00261‐knockdown or control AGS cells. Scale bar, 20 μm. Western blot analysis of phenotypic markers after linc00261 silencing (AGS). Relative protein expression was identified (n = 3) and normalized to β‐actin. Data represent the mean ± S.D.