Figure 1.

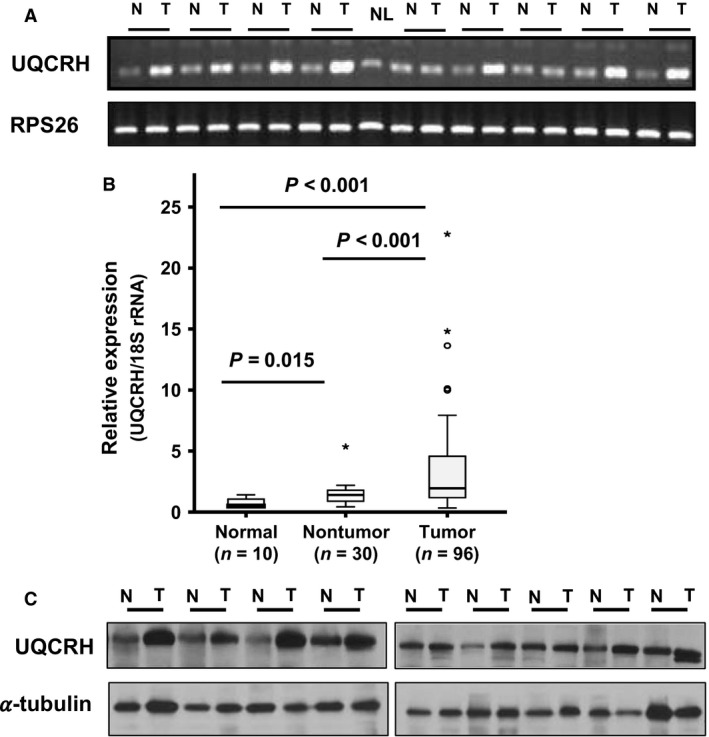
Overexpression of UQCRH in HCC. (A) UQCRH mRNA expression in HCC (T) and corresponding adjacent liver tissues (N), determined with semiquantitative RT‐PCR. NL indicates normal liver. (B) Box plot analysis illustrating differences in UQCRH mRNA expression levels between normal (n = 10), adjacent liver (n = 30), and HCC (n = 96) tissues. UQCRH expression was measured using real‐time RT‐PCR, with 18S rRNA as an internal control. (C) UQCRH protein level in pair‐marched HCC (T) and corresponding adjacent liver tissues (N) was determined by western blotting. *, More than 3/2 times of upper quartile.
