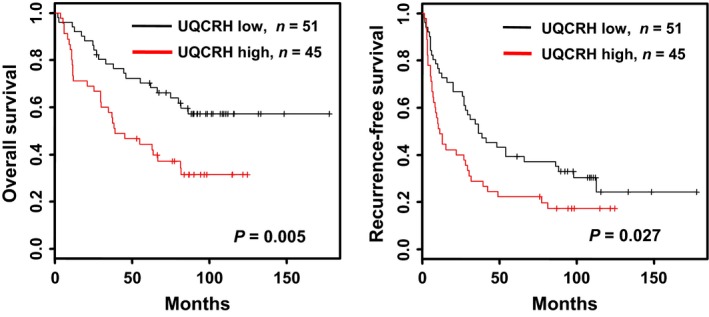
Figure 2.

Kaplan–Meier survival analysis according to UQCRH expression and survival times in HCC patients. Kaplan–Meier curves showing overall and recurrence‐free survival were plotted according to relative UQCRH expression levels (low, black line <2.1‐fold and high, red line ≥2.1‐fold). The P‐value was determined using log‐rank analysis.
