
Figure 1.
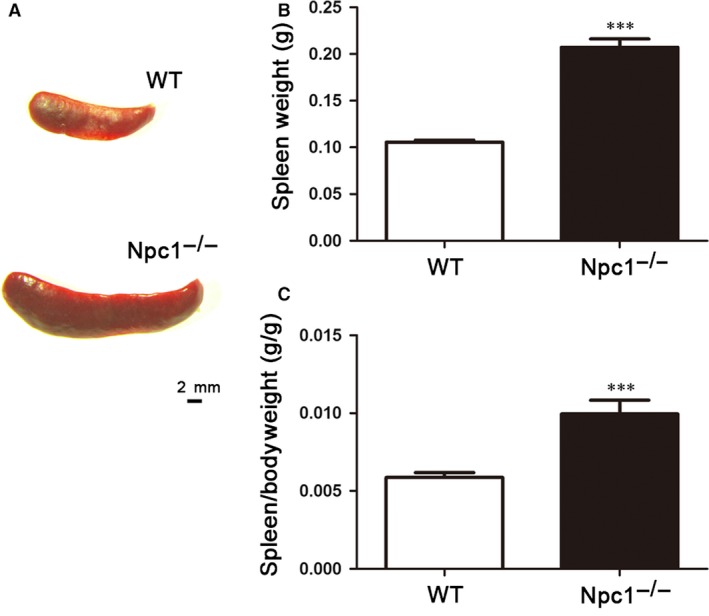
Enlarged spleen in Npc‐1−/− mice. Representative images of general view of the spleen (A), spleen weight (B) and spleen/bodyweight ratio (C). Scale bar = 2 mm labelled in A, n = 14. ***P < 0.001.
Official websites use .gov
A
.gov website belongs to an official
government organization in the United States.
Secure .gov websites use HTTPS
A lock (
) or https:// means you've safely
connected to the .gov website. Share sensitive
information only on official, secure websites.
Enlarged spleen in Npc‐1−/− mice. Representative images of general view of the spleen (A), spleen weight (B) and spleen/bodyweight ratio (C). Scale bar = 2 mm labelled in A, n = 14. ***P < 0.001.