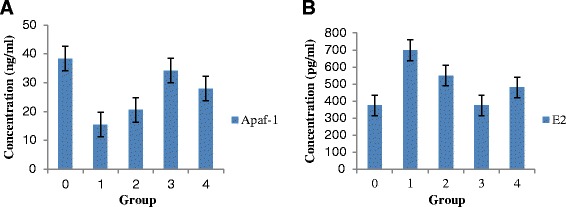
Fig. 4.

The serum level concentration of Apaf-1 (ng/ml) (Fig. 4a) and E2 (pg/ml) (Fig. 4b) in the rats of TH treated groups compared to the rats of normal and negative controls. Data are expressed as median interquartile range (IqR) using Kruskal-Wallis test. Values are statistically significant, p < 0.05. Legends: TH = Tualang Honey. Apaf-1 = Apoptotic protease activating factor-1. E2 = Estradiol
