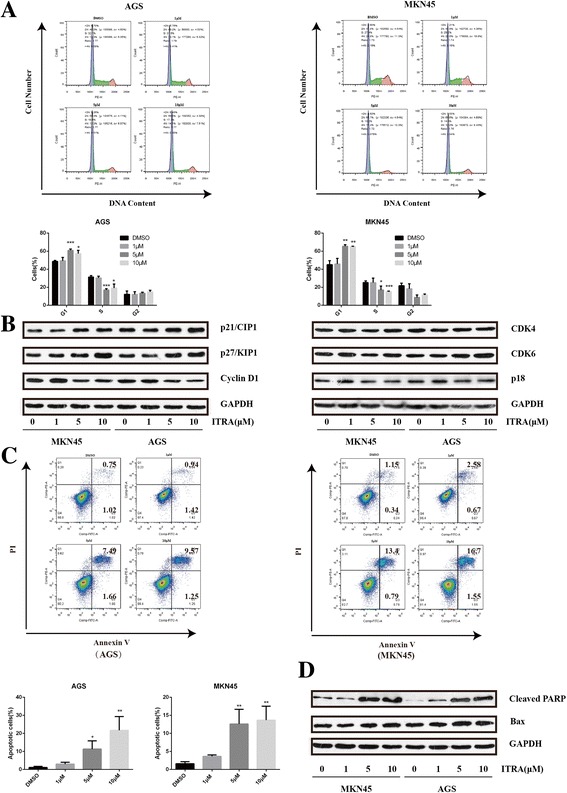
Fig. 2.

Effects of itraconazole on cell cycle distribution and apoptosis of gastric cancer cells. a Cell cycle distributions were detected by flow cytometry analysis in AGS and MKN45 cells after treatment with different concentrations of itraconazole or DMSO for 72 h. Data represent the mean of three experiments (mean ± SD). *p < 0.05; **P <0.01, compared to DMSO treated cells. b The expression of cell cycle-related proteins is examined by immunoblot assay. AGS and MKN45 cells are harvested after itraconazole treatment for 48 h. GAPDH is used as a loading control. c Cell apoptosis is determined by flow cytometry analysis in AGS and MKN45 cells after treatment with different concentrations of itraconazole or DMSO for 72 h. Data represent the average of three experiments (mean ± SD). *P <0.05 and **P <0.01 vs DMSO treated cells. d The Bax expression at protein level is examined by immunoblot assay. GAPDH is used as a loading control
