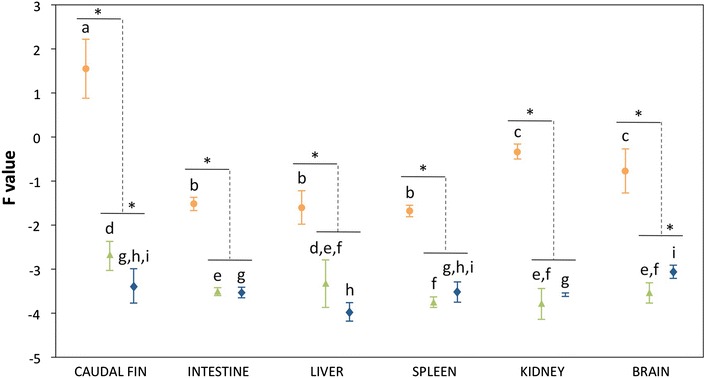
Figure 2.

Relative MCP gene expression values in samples of gilthead seabream juveniles. Experimental groups: diseased, orange; asymptomatic, green; recovered, blue. Different letters indicate significant differences between organs in the same experimental group. *Significant differences between groups. Significant level p < 0.01 (Mann–Whitney U test, Holm–Bonferroni correction). Error bars represent ± standard deviation (n = 9).
