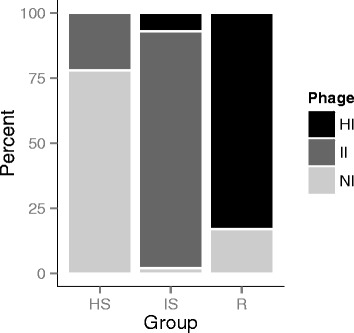
Fig. 3.

Relative proportion of high infective (HI; black), intermediate infective (II; dark grey) and non-infective (NI; light grey) phage lysates per bacterial group (HS highly susceptible, IS: intermediate susceptible and R: resistant)

Relative proportion of high infective (HI; black), intermediate infective (II; dark grey) and non-infective (NI; light grey) phage lysates per bacterial group (HS highly susceptible, IS: intermediate susceptible and R: resistant)